


Market Cycles
As of 26 July 2026
As of 26 July 2026
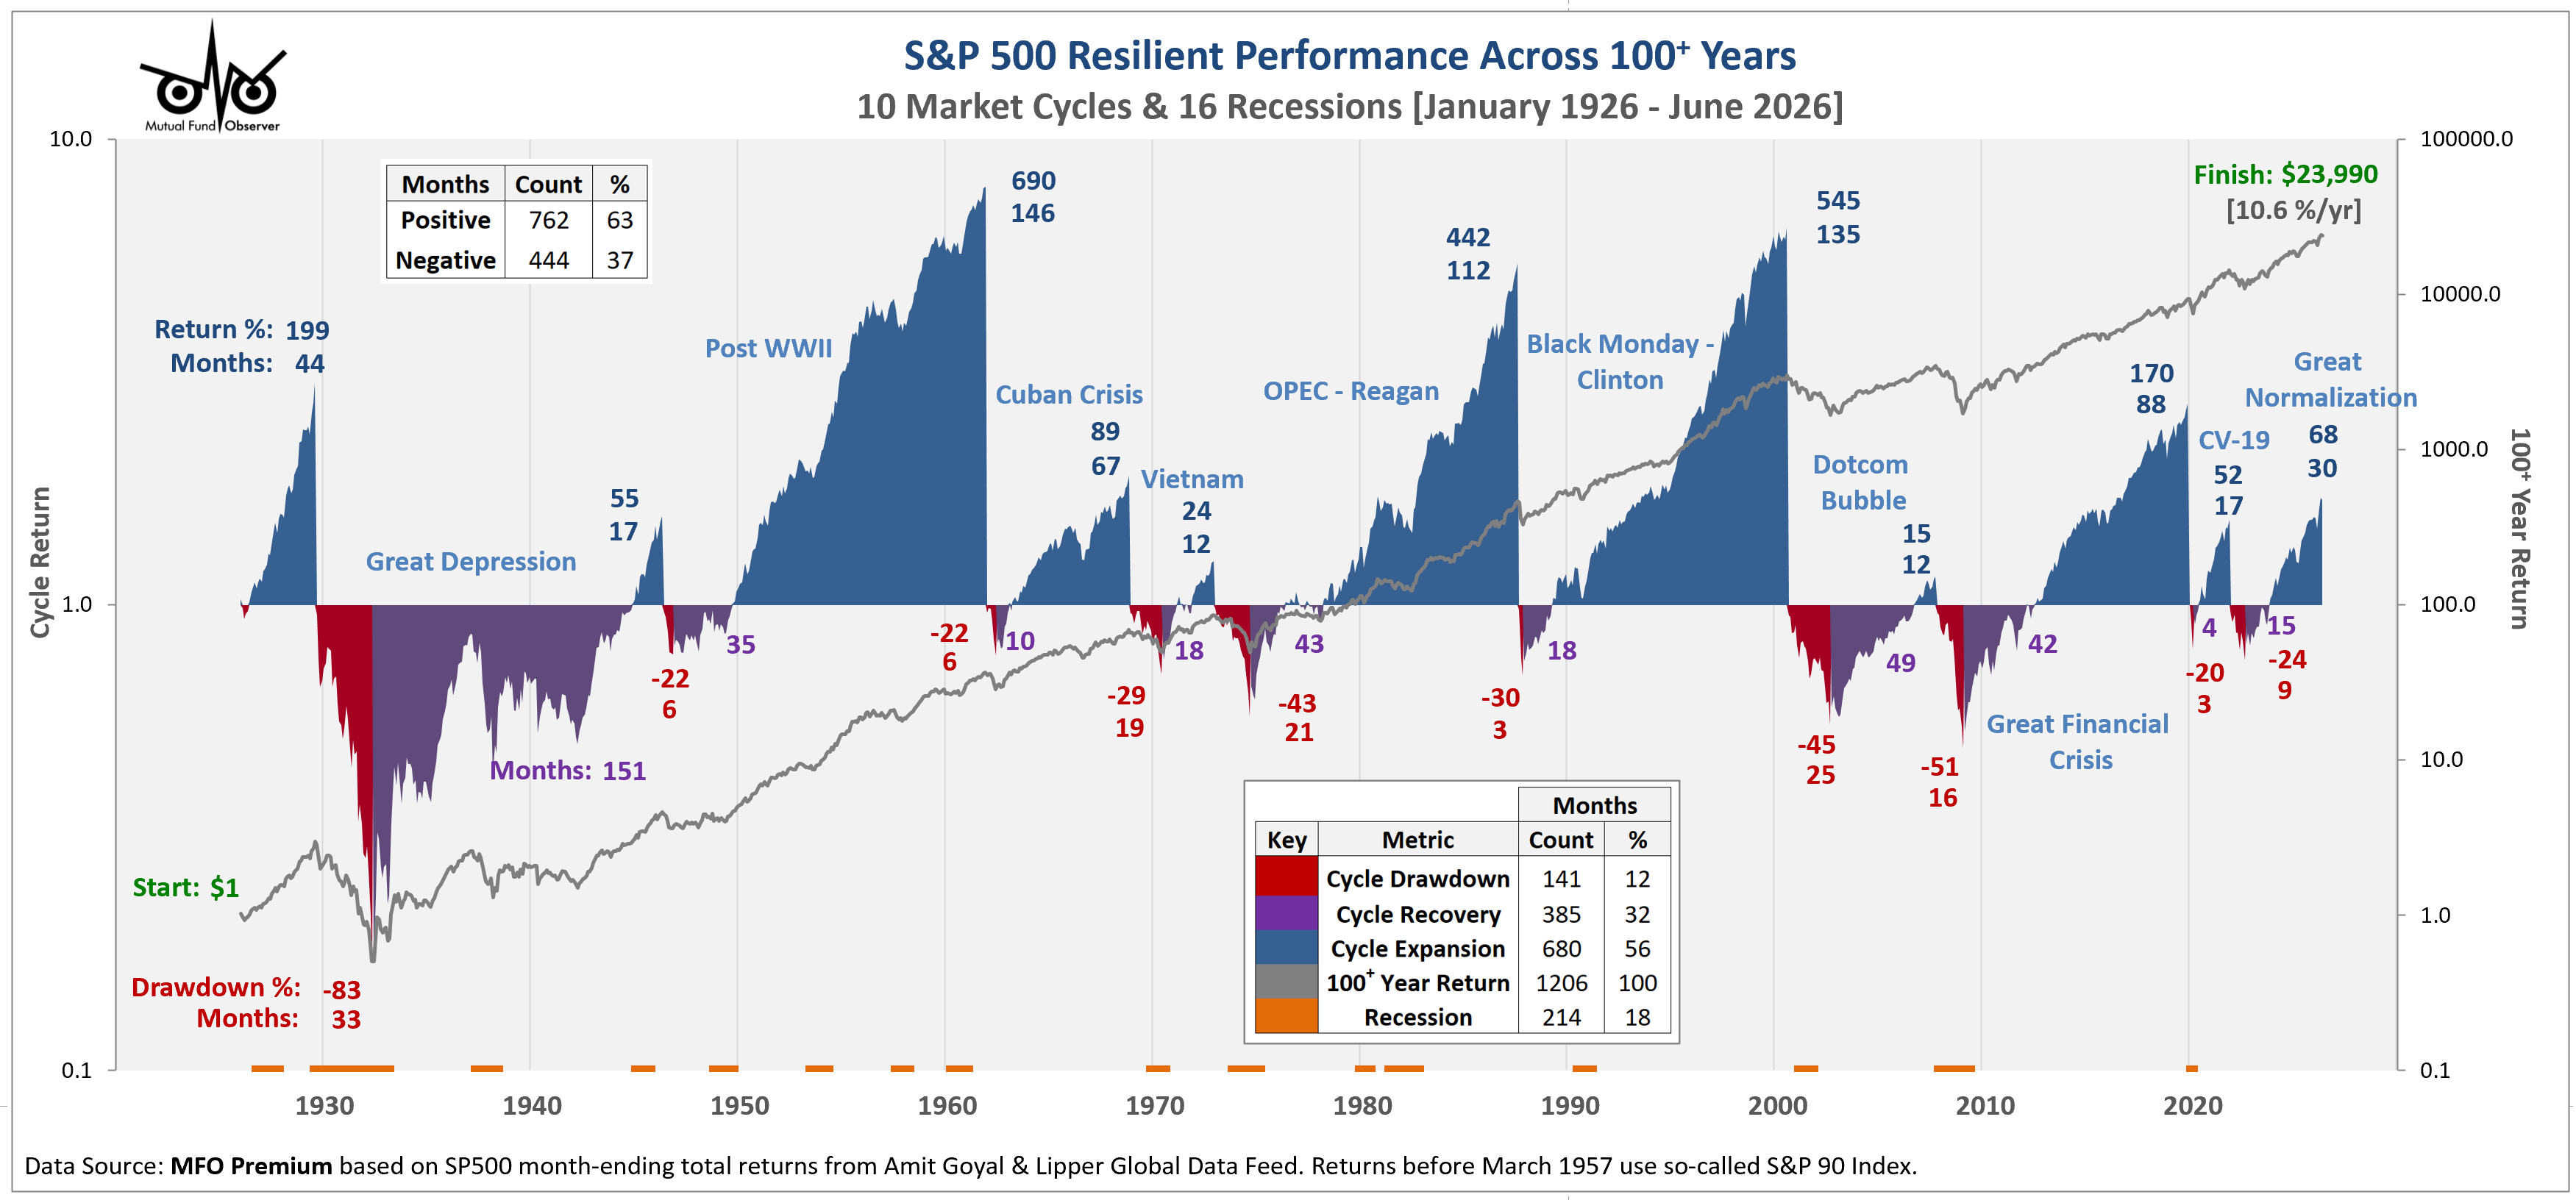
The Market Cycles page presents risk and return metrics of US market cycles based on the S&P 500 since January 1926. It complements
the One Hundred Years page.
The data contained on this page have formed the basis of several articles and posts on MFO and MFOP on long-term performance and cycles
(e.g., Strong June Propels New Bull Market [July 2023]). The page will be updated
quarterly, at least, in hopes of providing a helpful reference for individual investors, financial advisors, and fund managers.

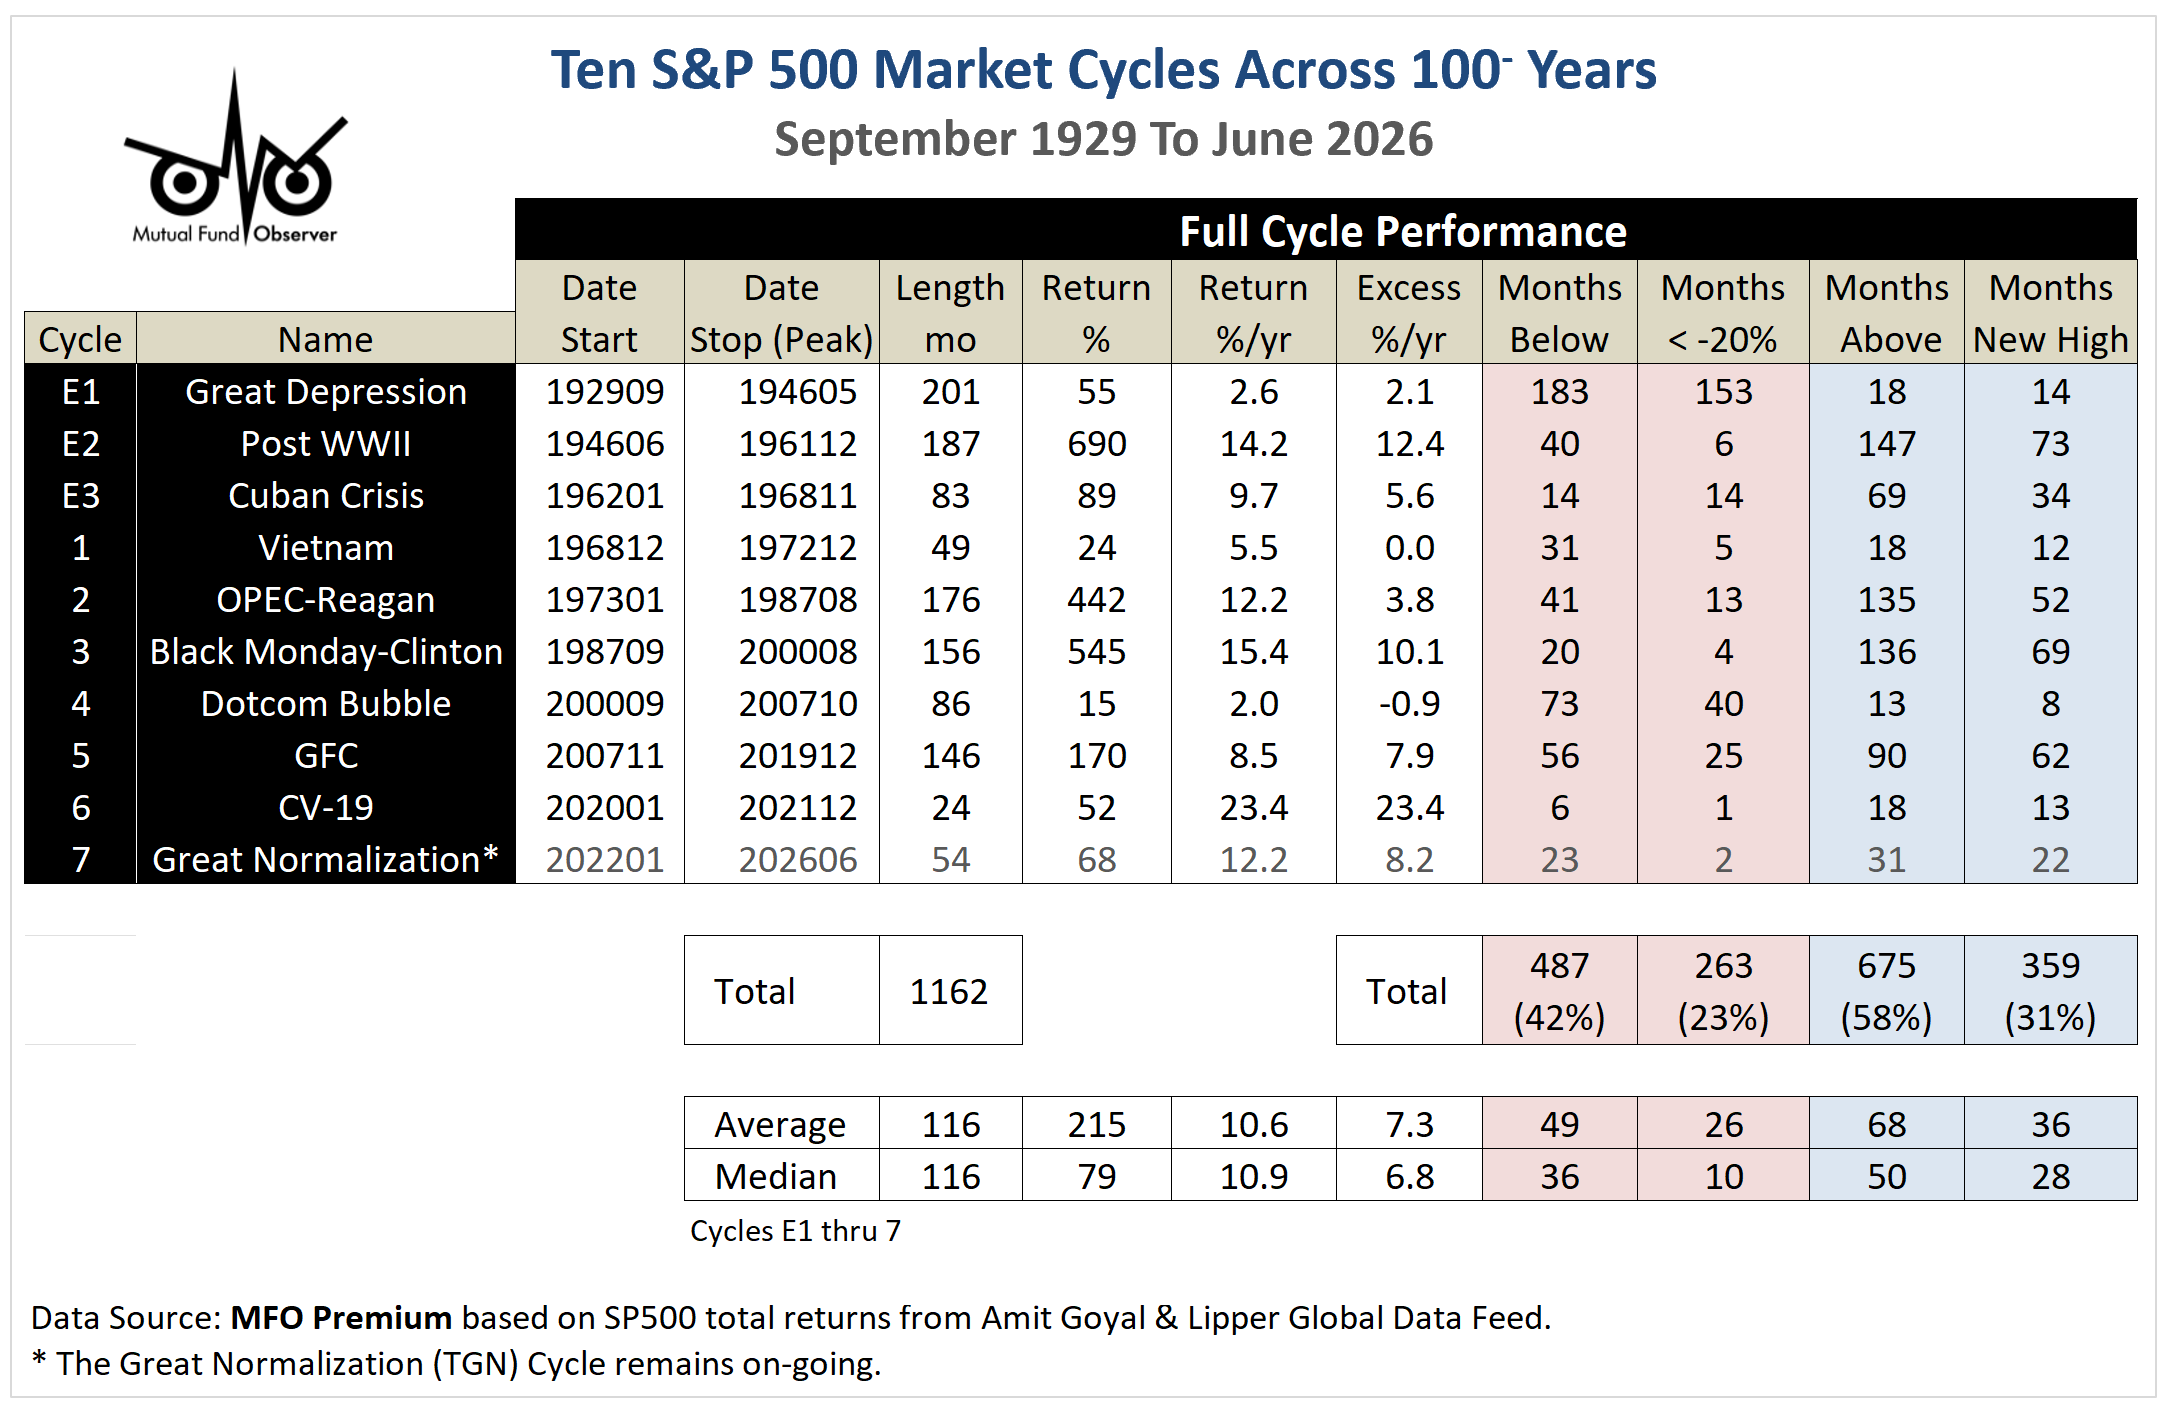
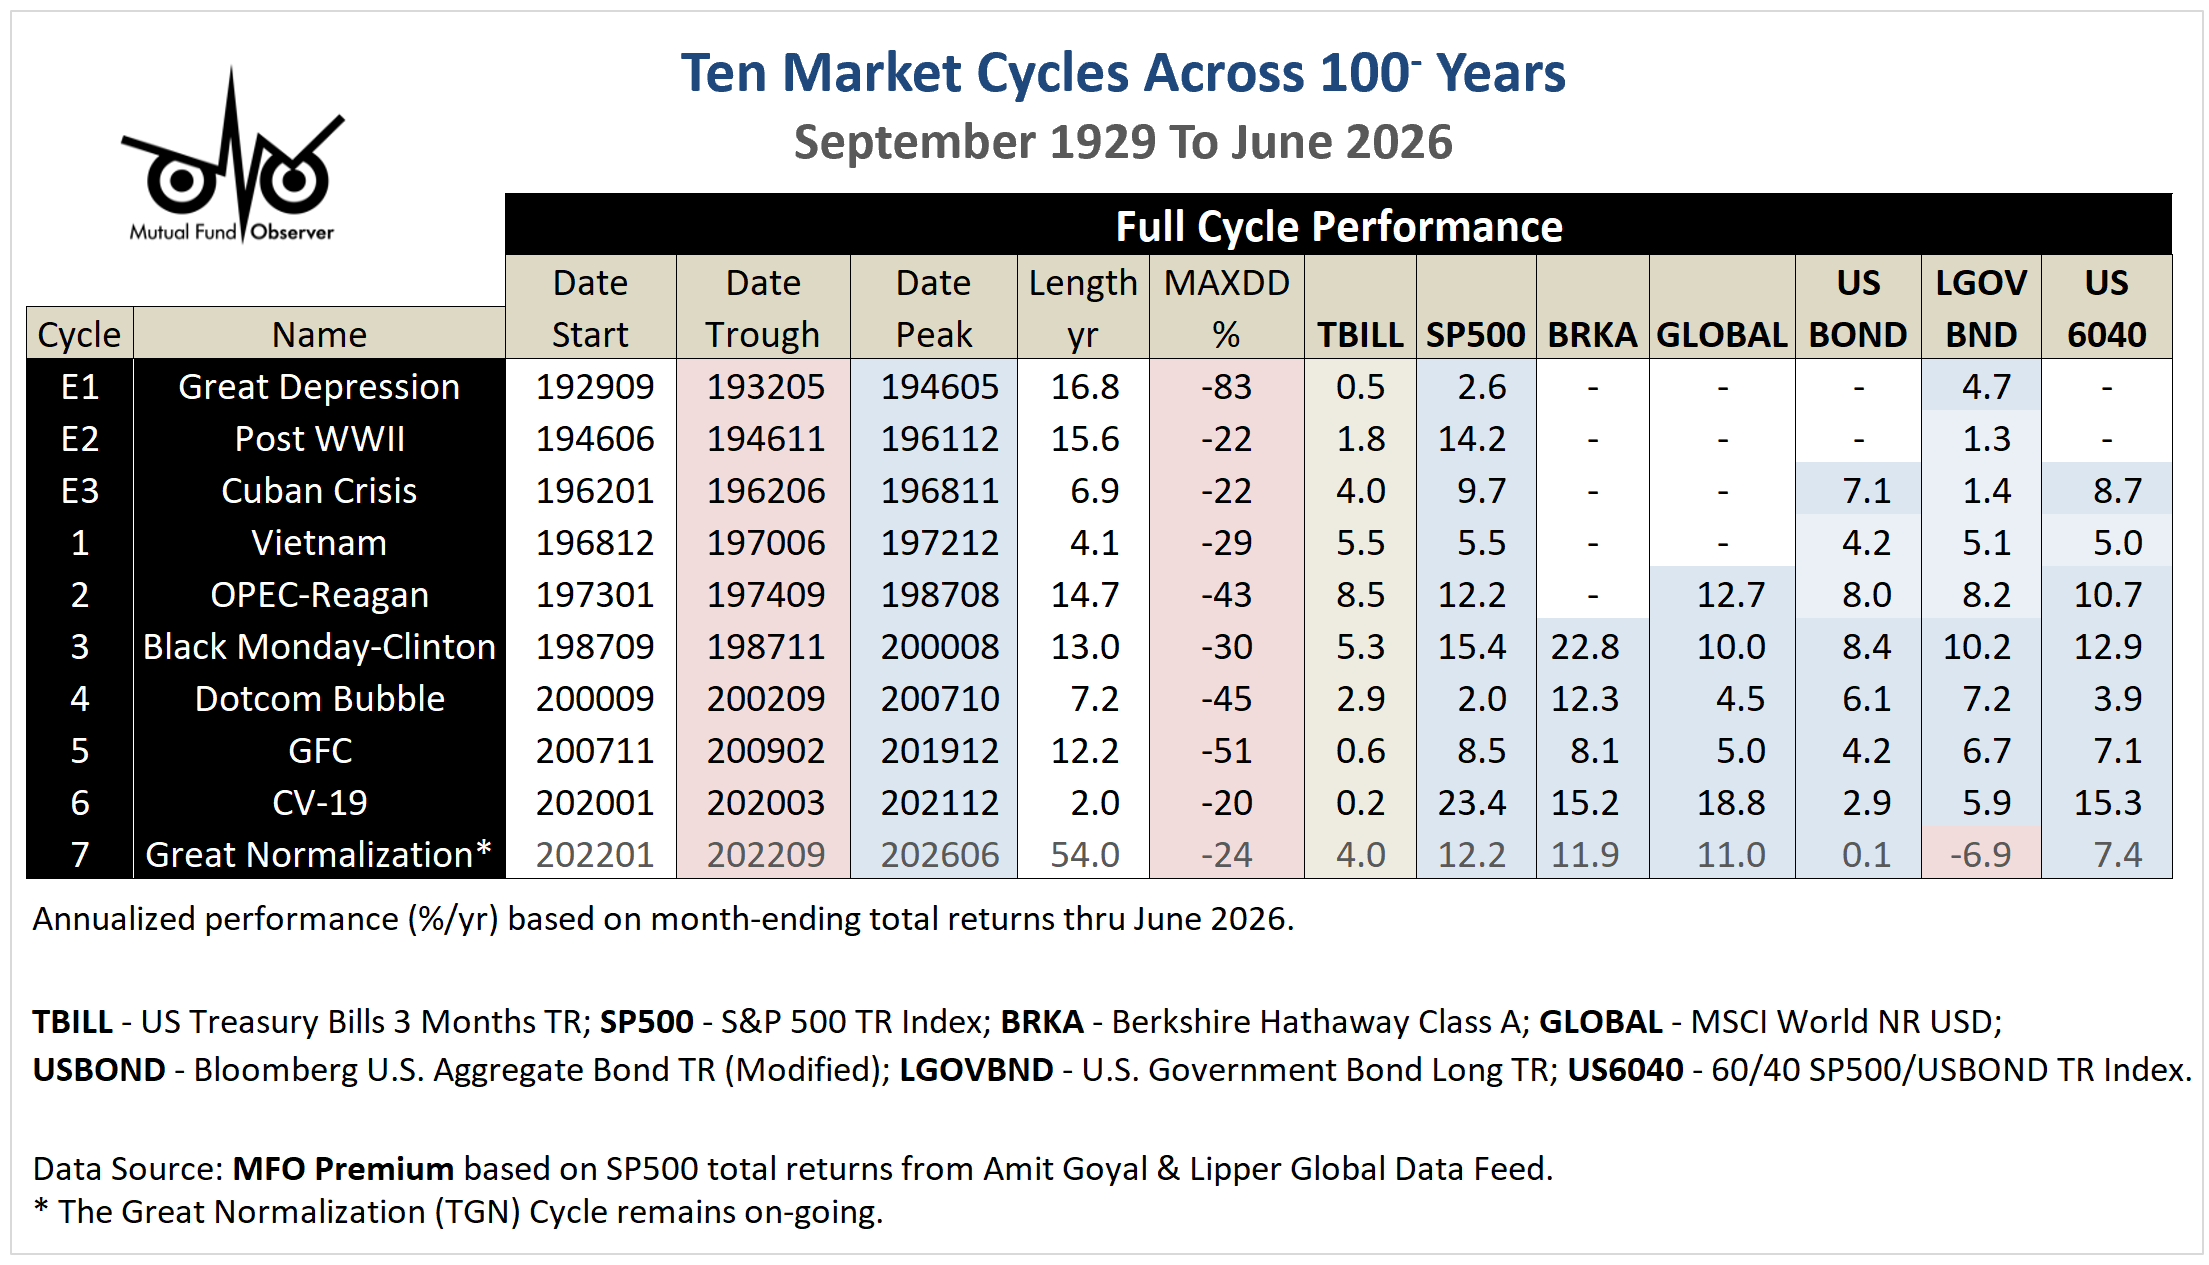
The charts are organized under the heading Ten US Market Cycles Since 1929.
SP500 returns before March 1957 use so-called S&P 90 Index. Returns before 1960 are from Professor Amit Goyal. All other returns are from Lipper Global Data Feed. All calculations use month-ending returns and results are available by using MultiSearch, the main tool on MFOP.
Click on any chart to expand. Click on icon near upper right corner to download a PNG image file.
For reference, our series on long-term returns and market cycles for US equities, which includes methodology, is summarized here:
The charts are organized under the heading Ten US Market Cycles Since 1929.
SP500 returns before March 1957 use so-called S&P 90 Index. Returns before 1960 are from Professor Amit Goyal. All other returns are from Lipper Global Data Feed. All calculations use month-ending returns and results are available by using MultiSearch, the main tool on MFOP.
Click on any chart to expand. Click on icon near upper right corner to download a PNG image file.
For reference, our series on long-term returns and market cycles for US equities, which includes methodology, is summarized here:
- The Great Normalization [July 2022]
- Early Cycle Metrics [December 2021]
- Super Bull Markets [November 2021]
- A Thirty Year Proposition [September 2020]
- A Presumptive Bear Ends an 11-Year Bull Run [April 2020]
- Mediocrity and Frustration [November 2014]
- Ten Market Cycles [March 2014]
Ten US Market Cycles Since 1929