

Sixty Years
As of 26 July 2026
As of 26 July 2026
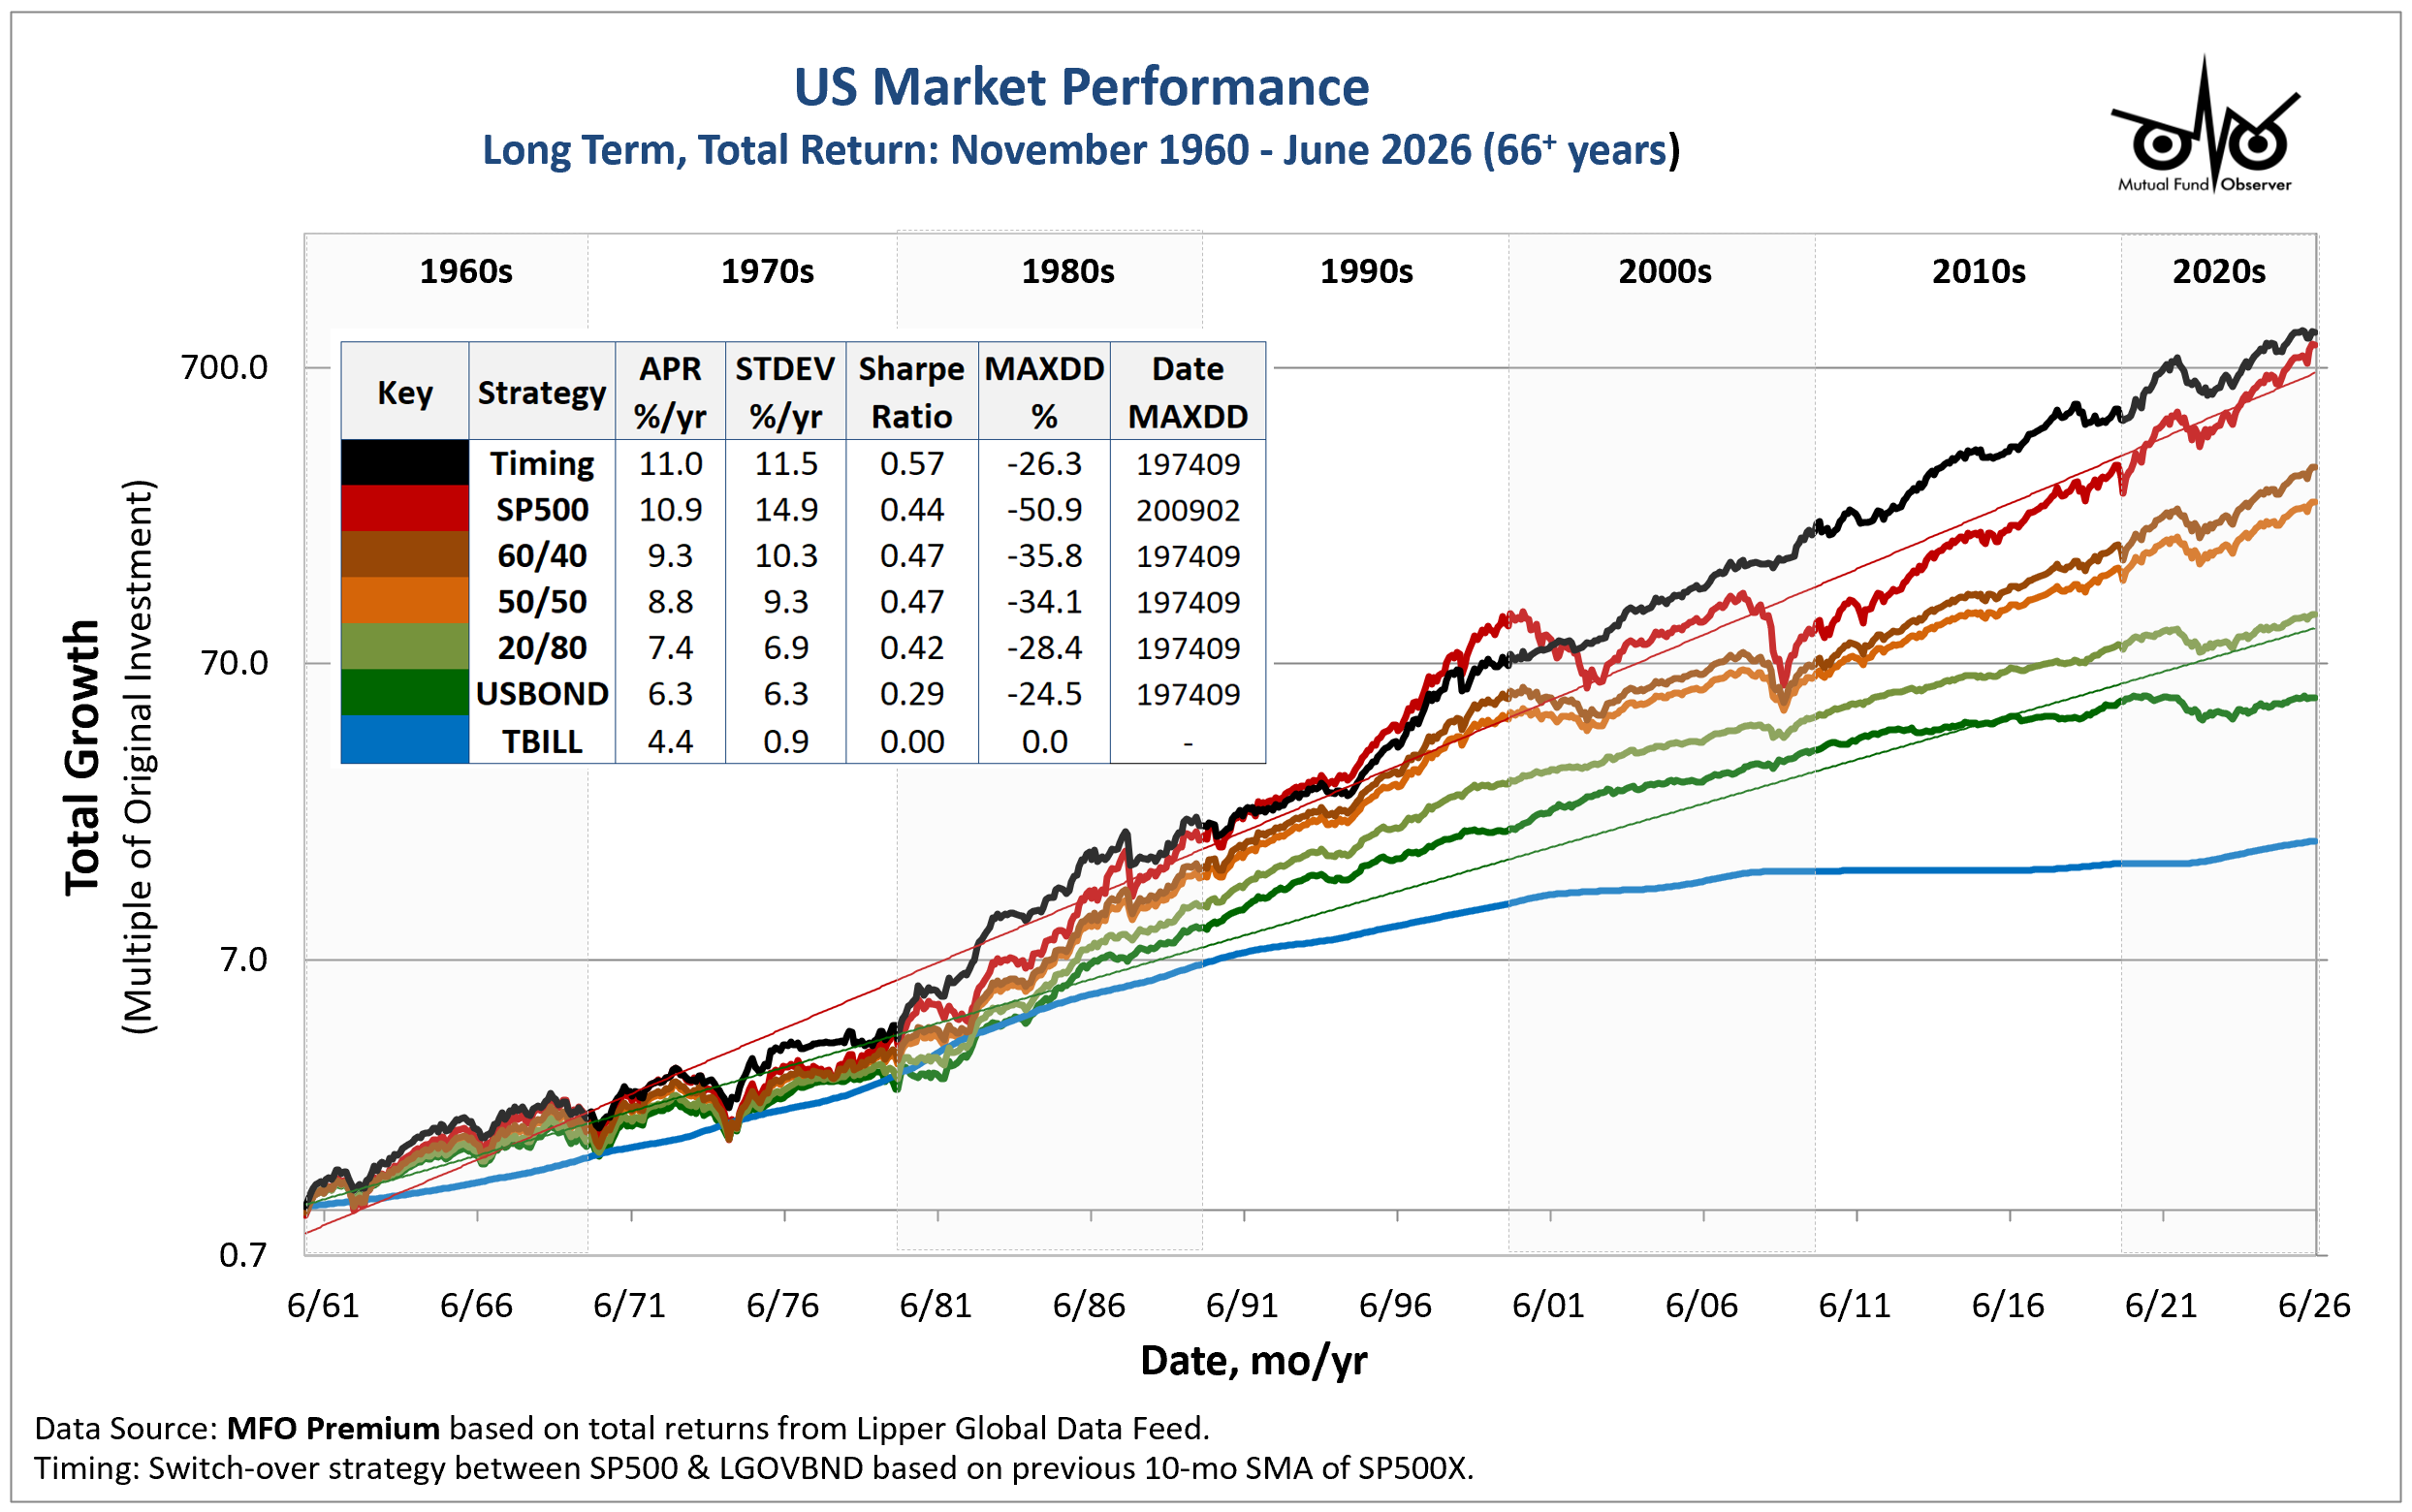
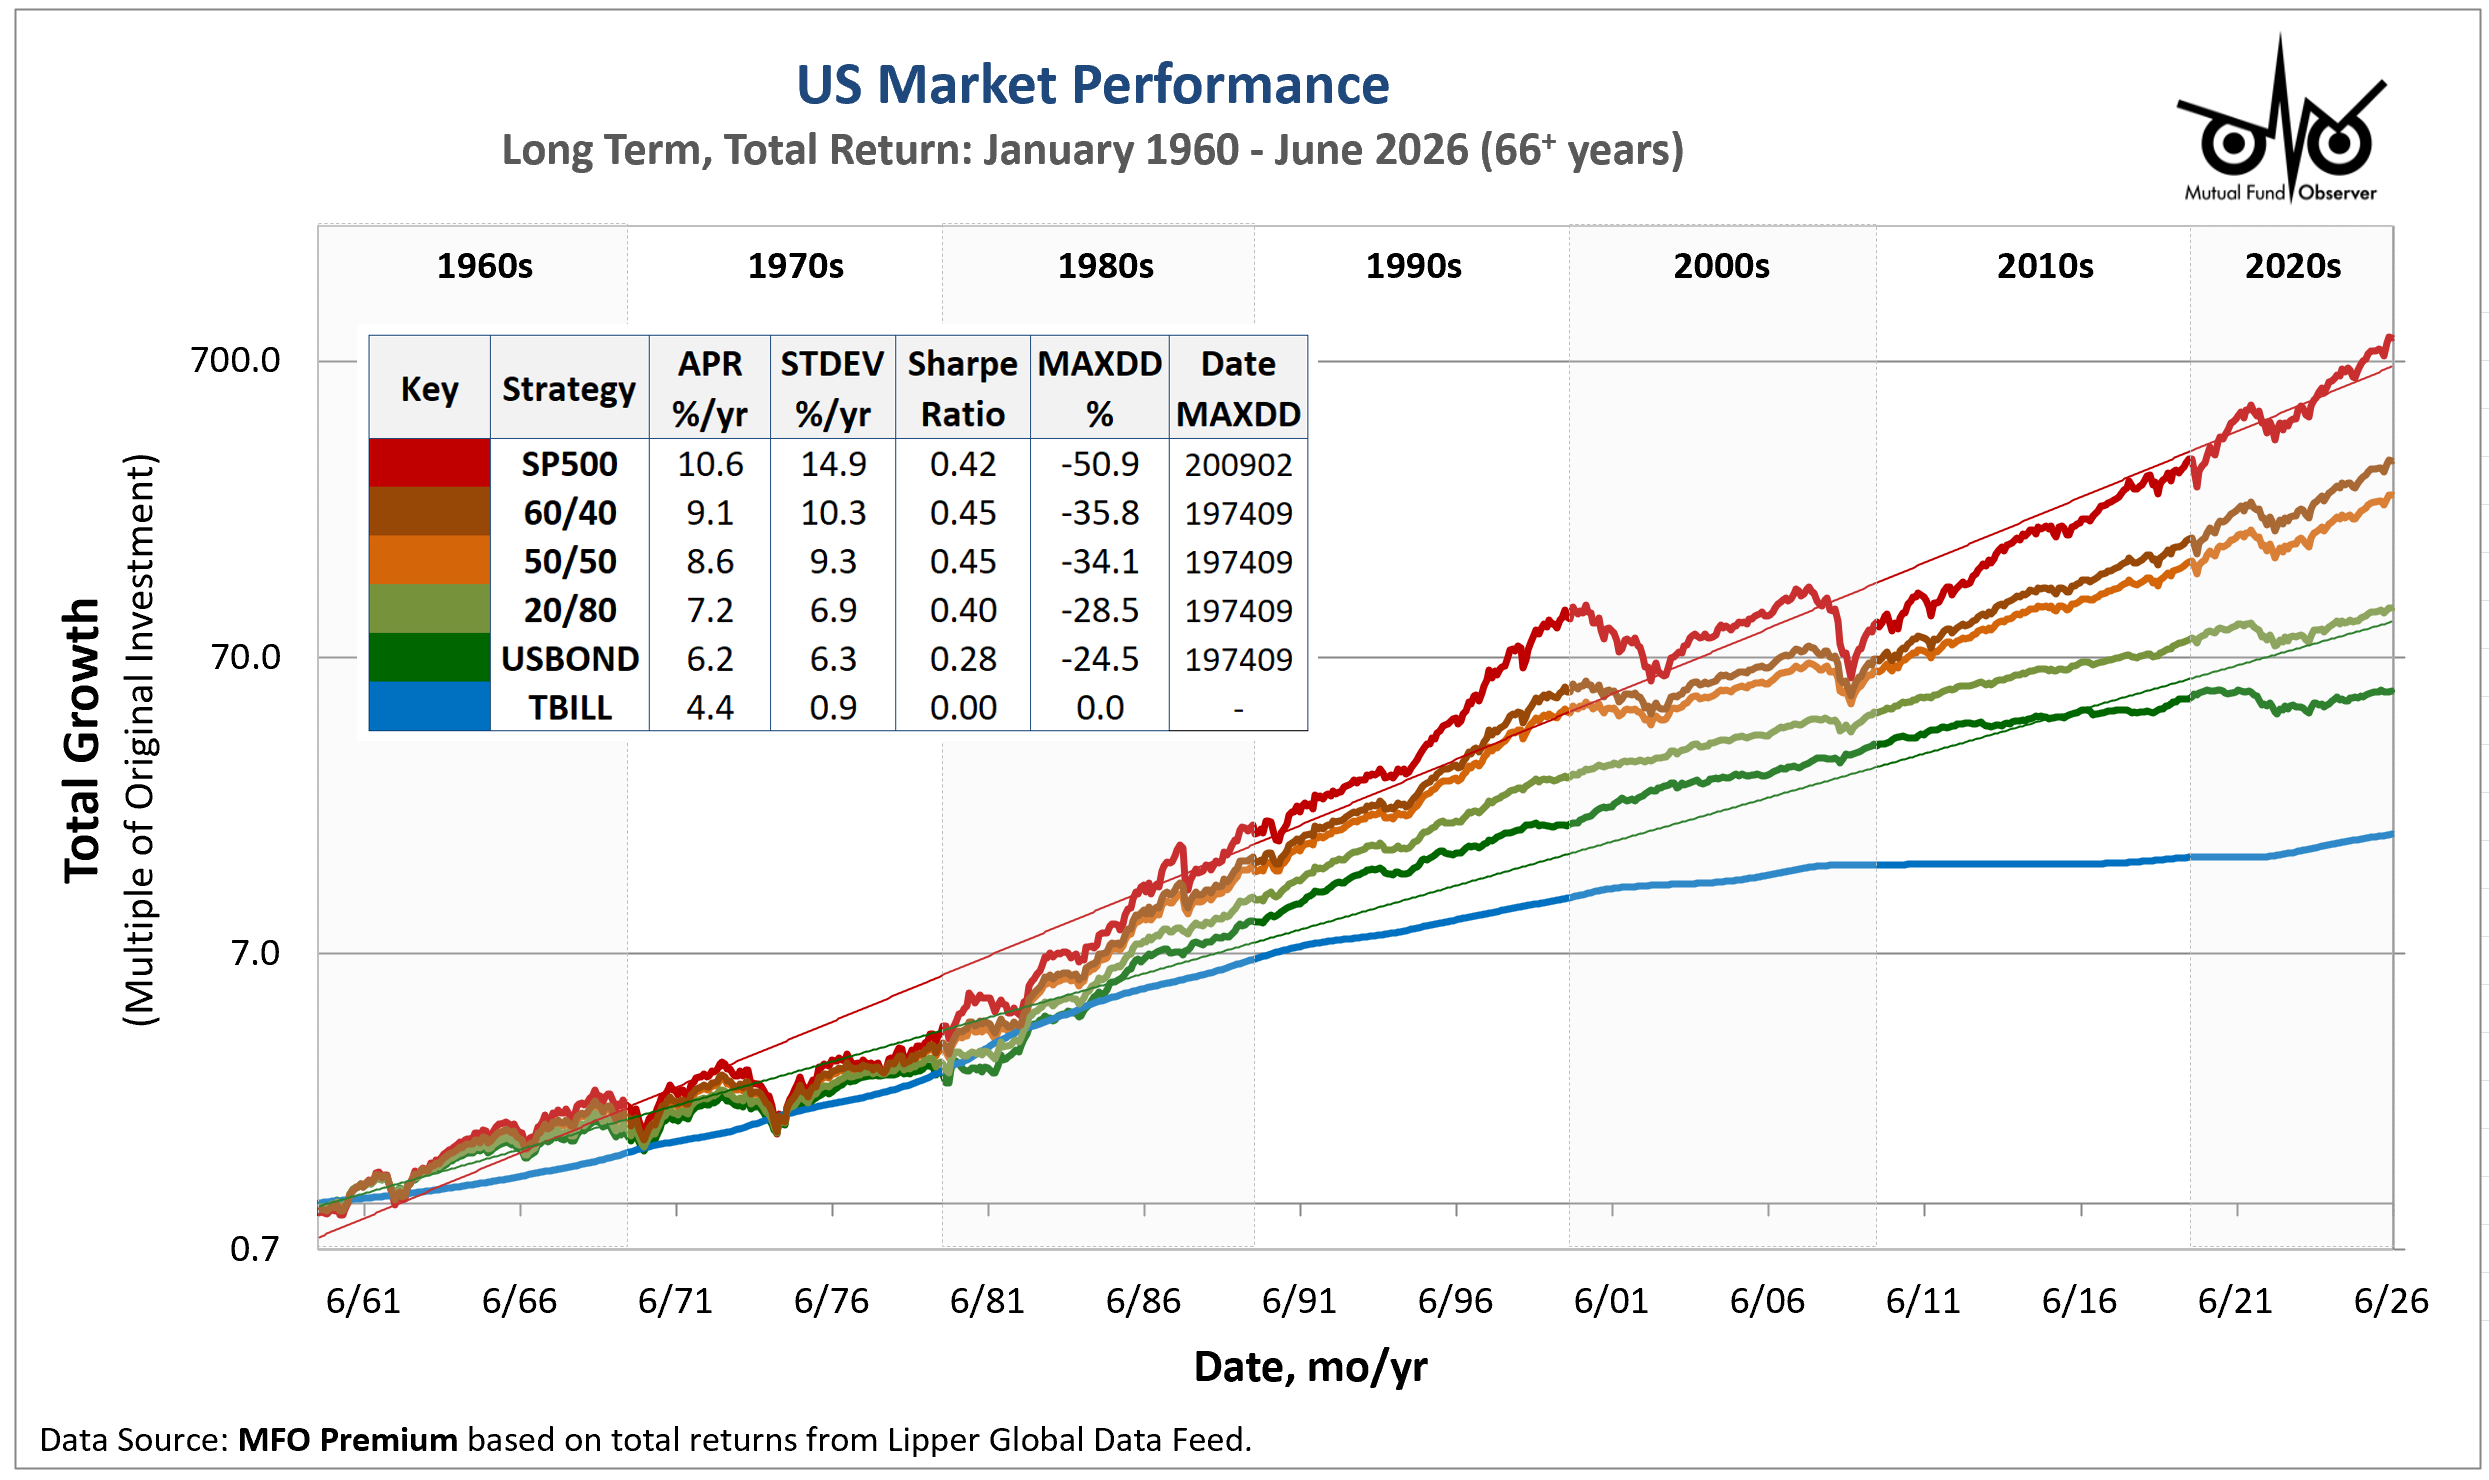
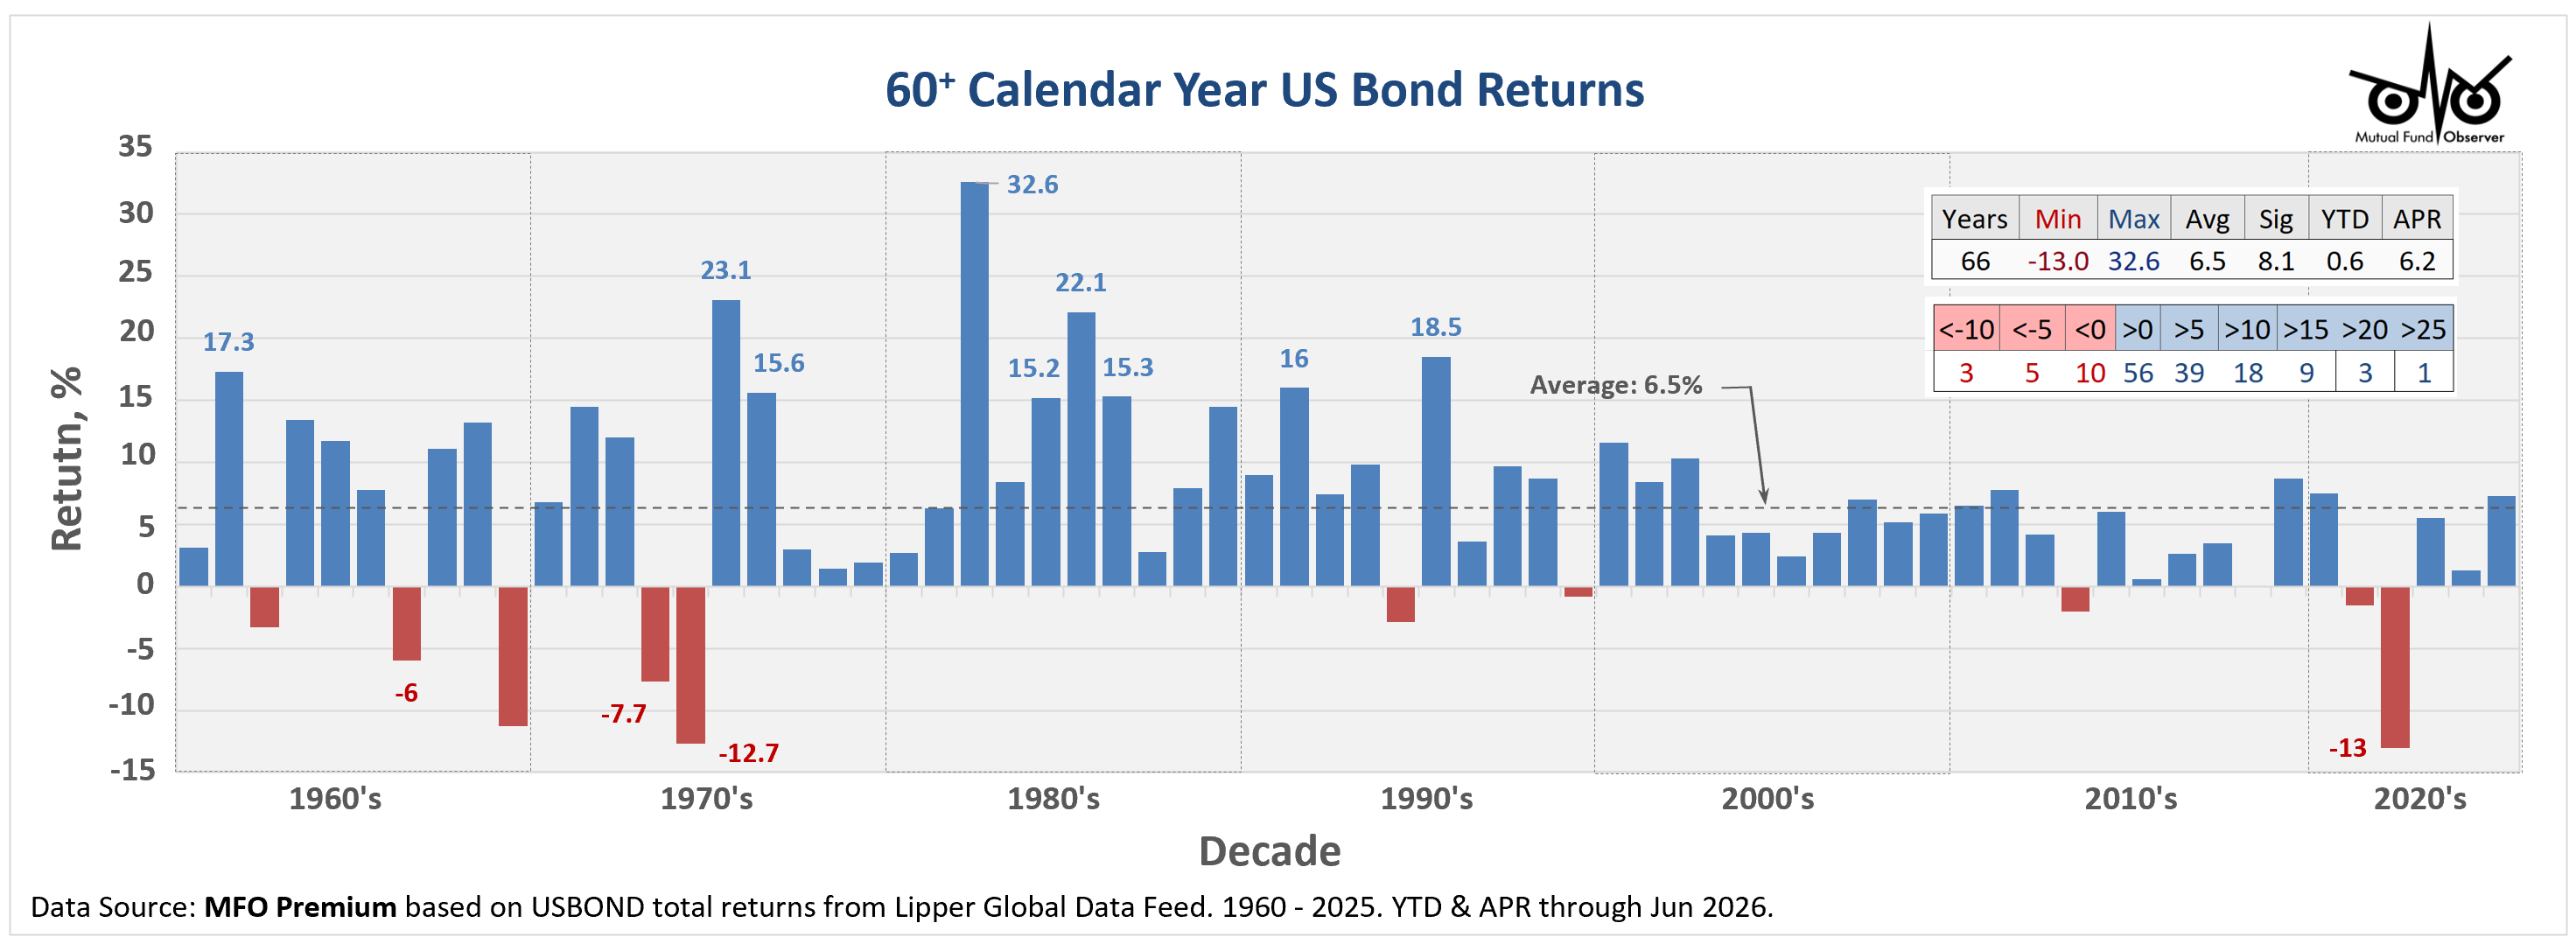
The Sixty Years page compiles US stock and bond market risk and return data since January 1960 in single place. It complements
the One Hundred Years page, but uses the
aggregate bond index [USBOND, like AGG] instead of the long bond index [LGOVBOND, like TLT] when summarizing allocation risk and reward.
The page will be updated quarterly, at least, in hopes of providing a helpful reference for individual investors, financial advisors, and
fund managers.

The charts are organized under the heading US Market Risk & Return Metrics Since 1960. Here is the summary of contents: Click on any chart to expand. Click on icon near upper right corner to download a PNG image file.
All calculations use month-ending returns and results are available by using MultiSearch, the main tool on MFOP.
The charts are organized under the heading US Market Risk & Return Metrics Since 1960. Here is the summary of contents: Click on any chart to expand. Click on icon near upper right corner to download a PNG image file.
All calculations use month-ending returns and results are available by using MultiSearch, the main tool on MFOP.
US Market Risk & Return Metrics Since 1960 - Basic Charts


US Market Risk & Return Metrics Since 1960 - Rolling Charts


US Market Risk & Return Metrics Since 1960 - Basic Tables


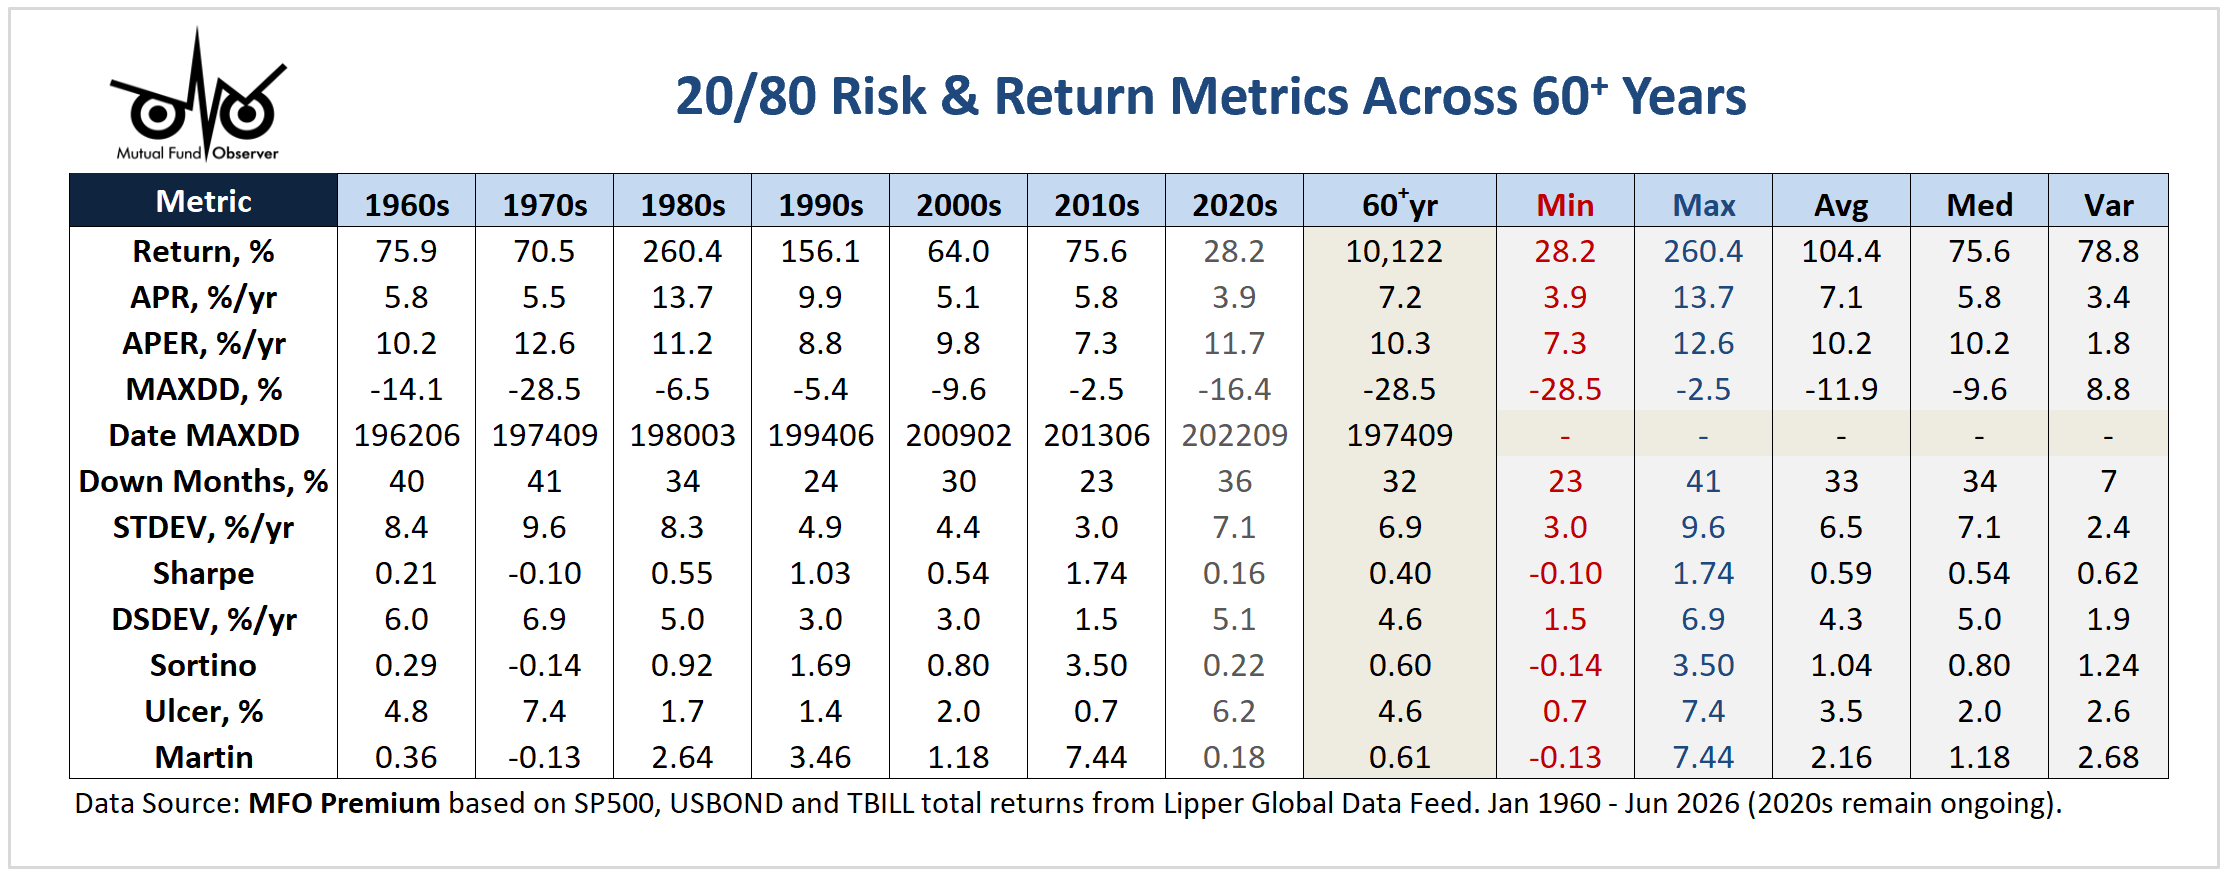

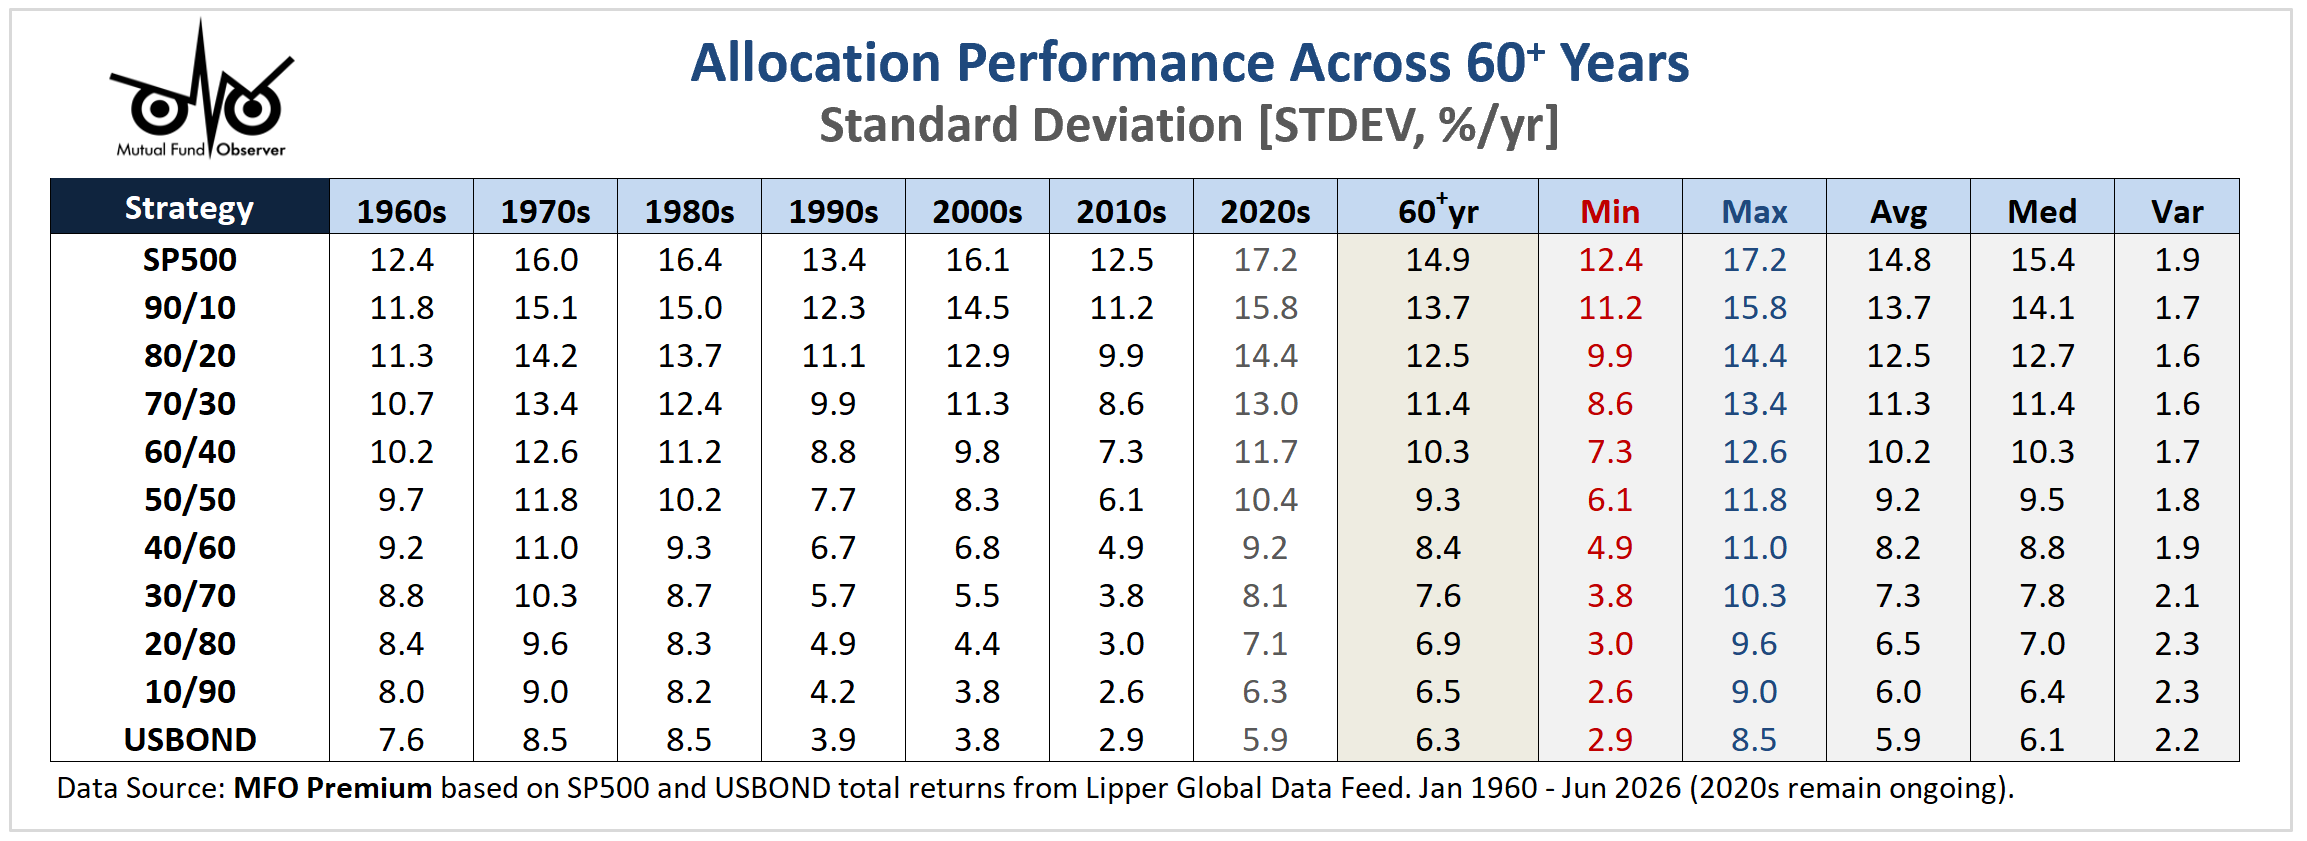
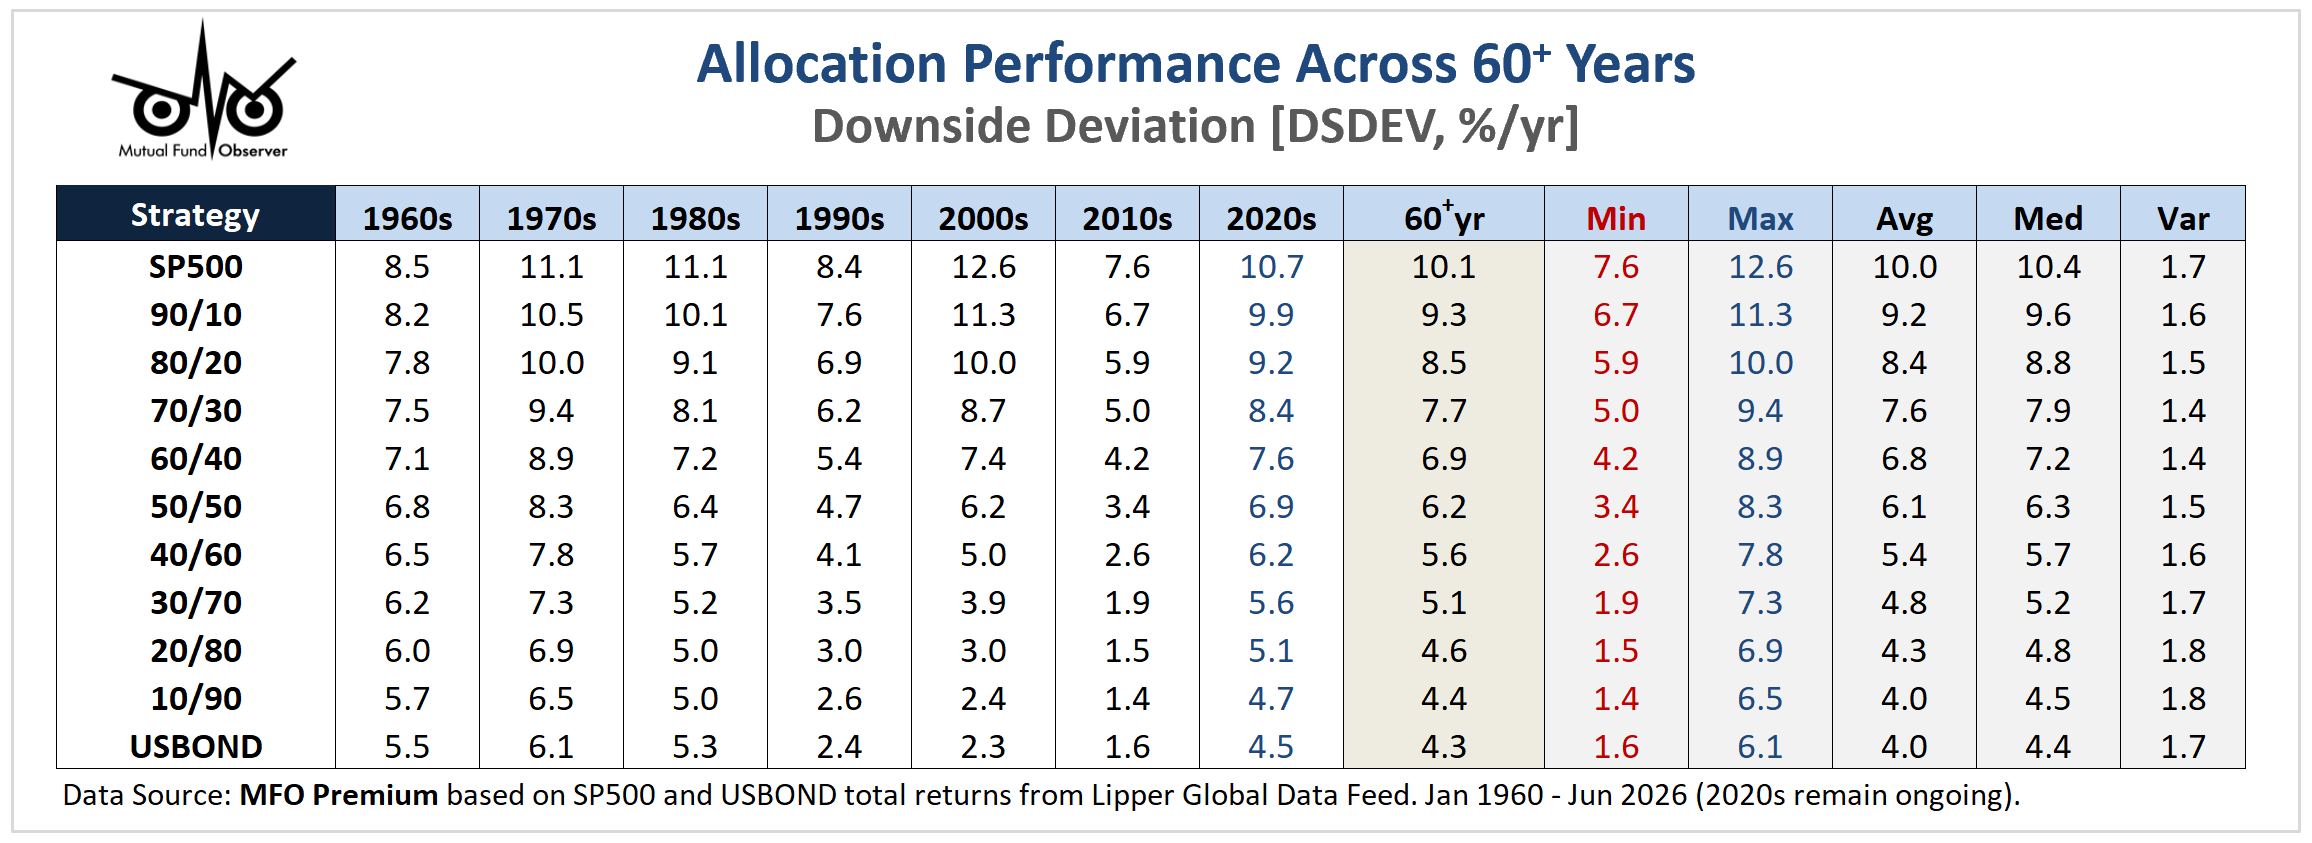
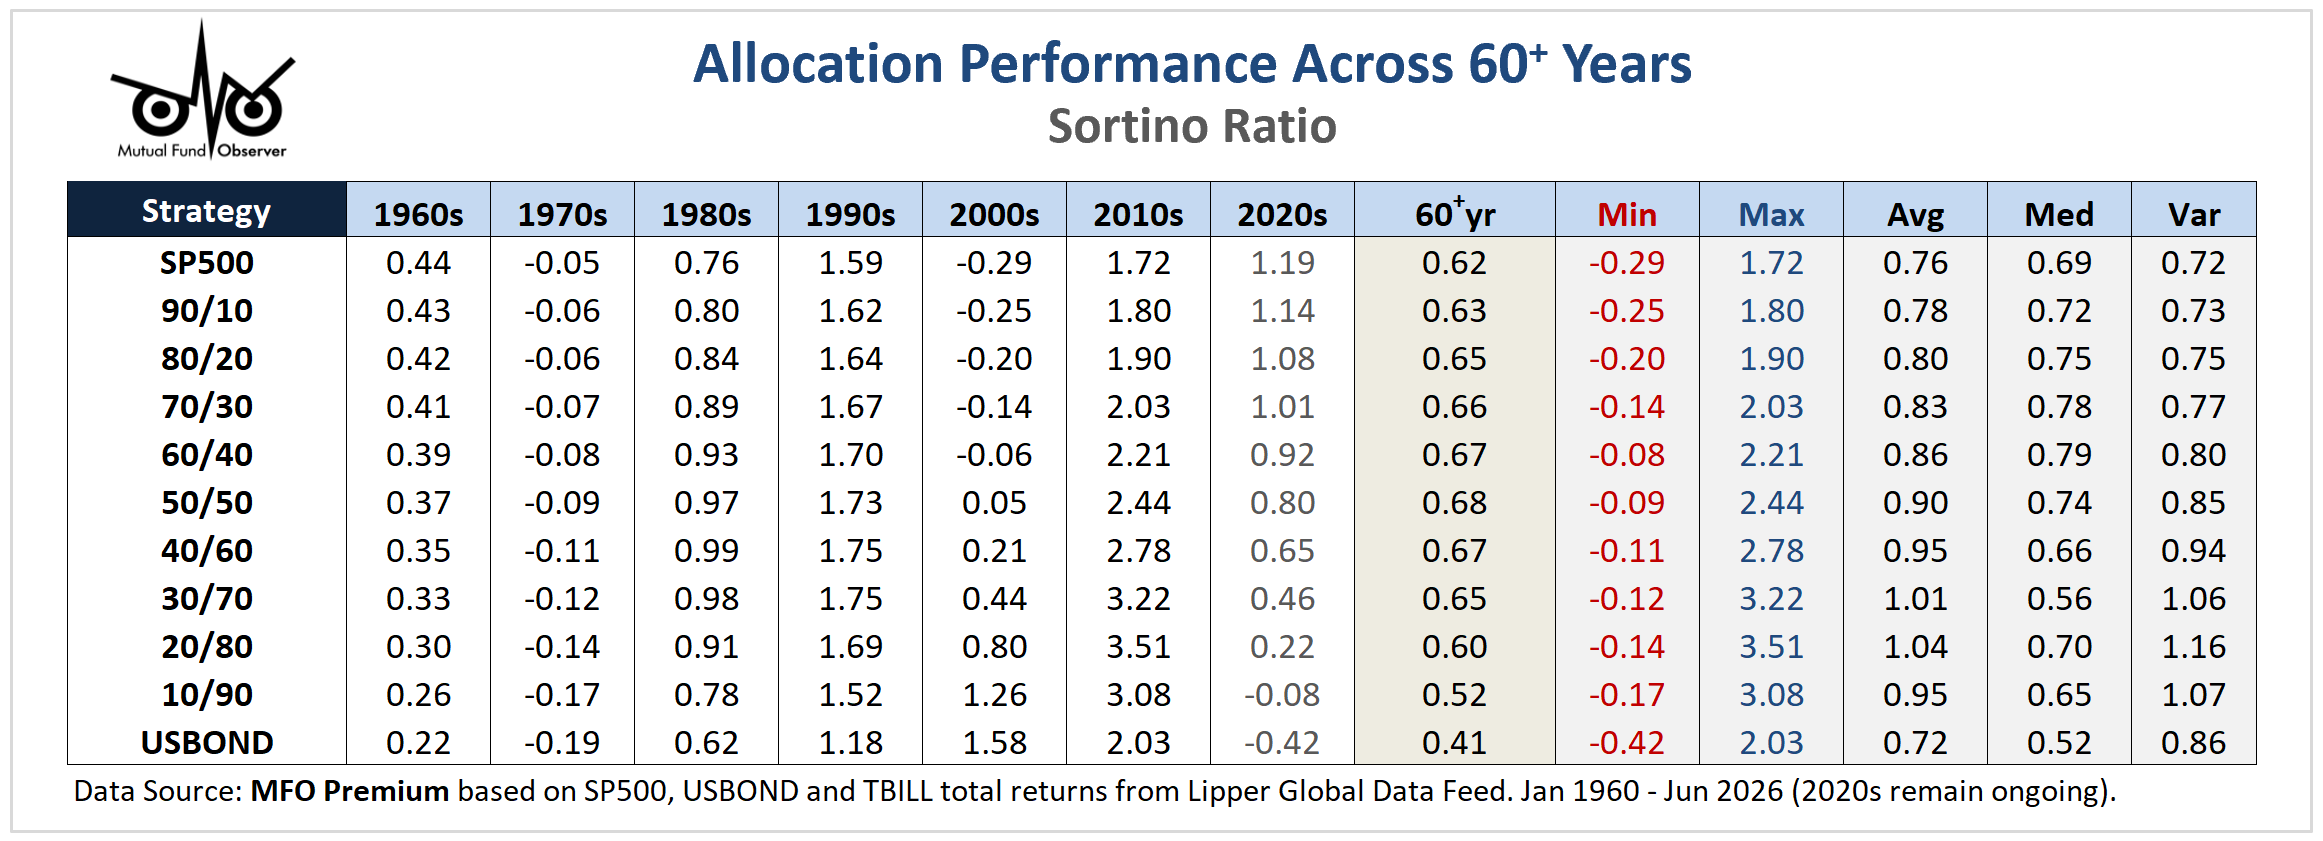
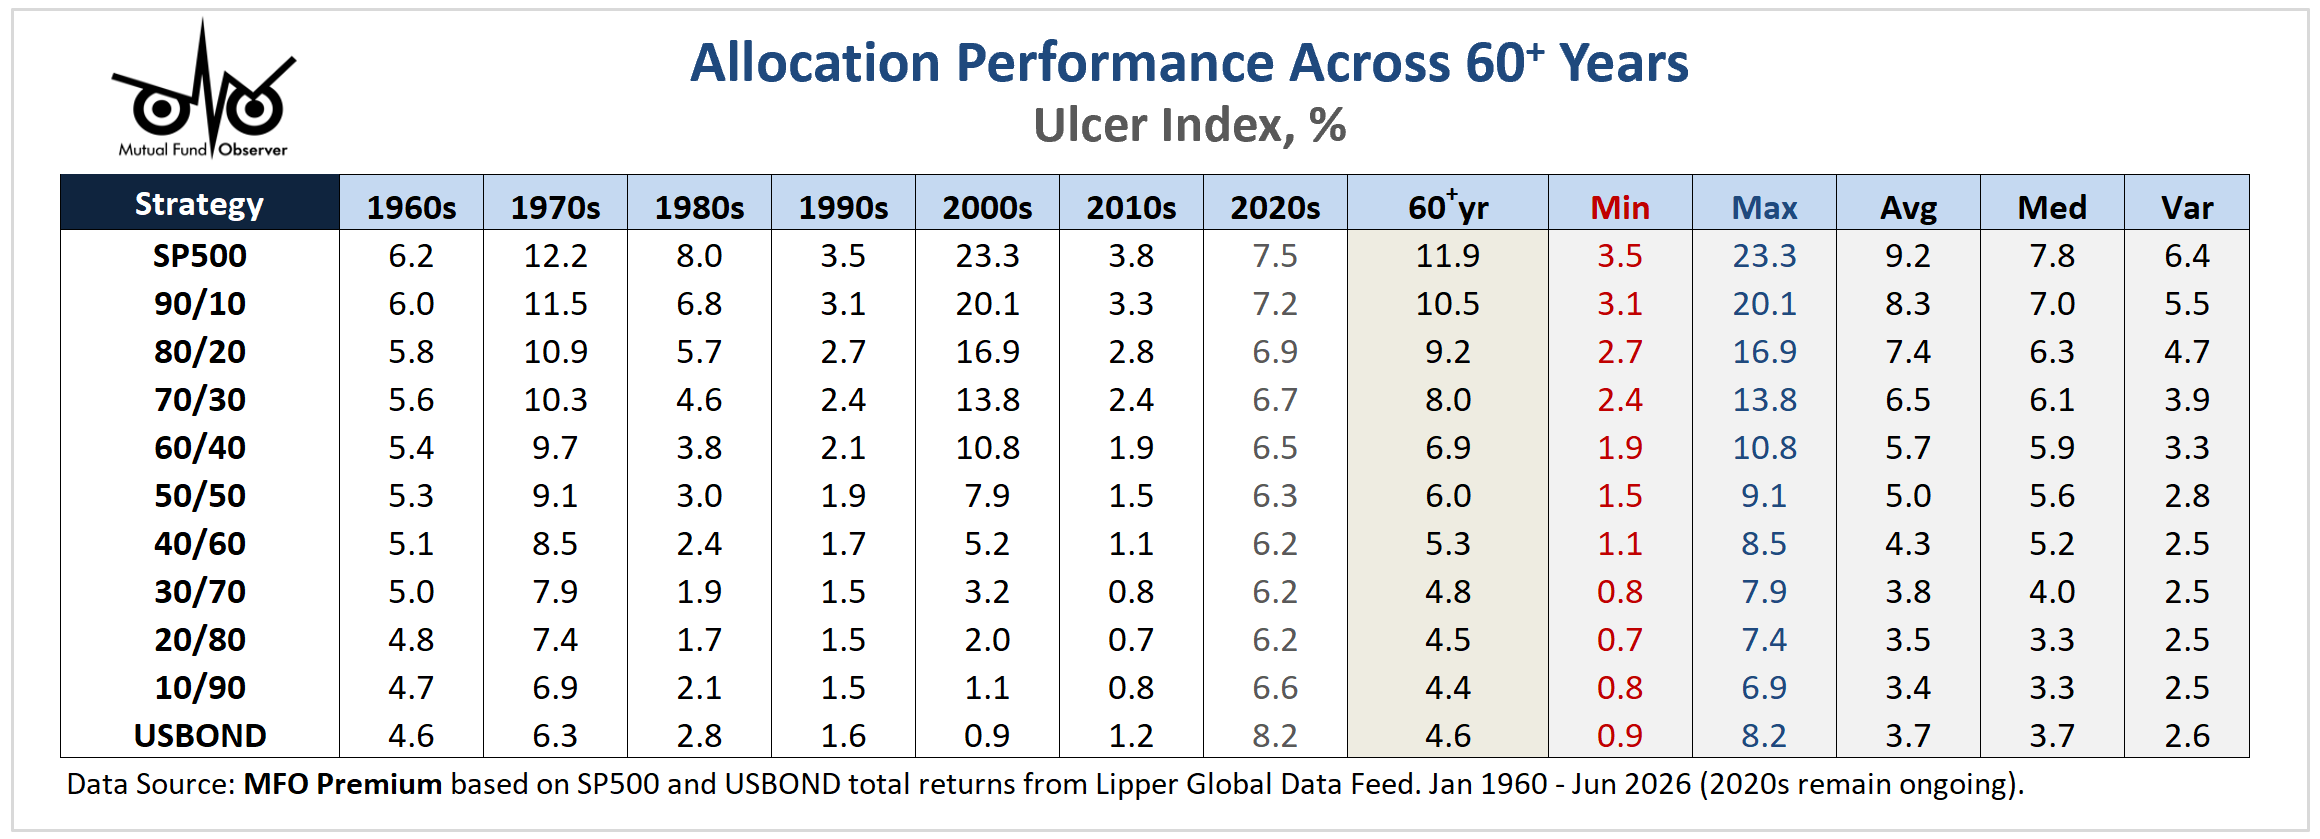
US Market Risk & Return Metrics Since 1960 - Allocation Tables
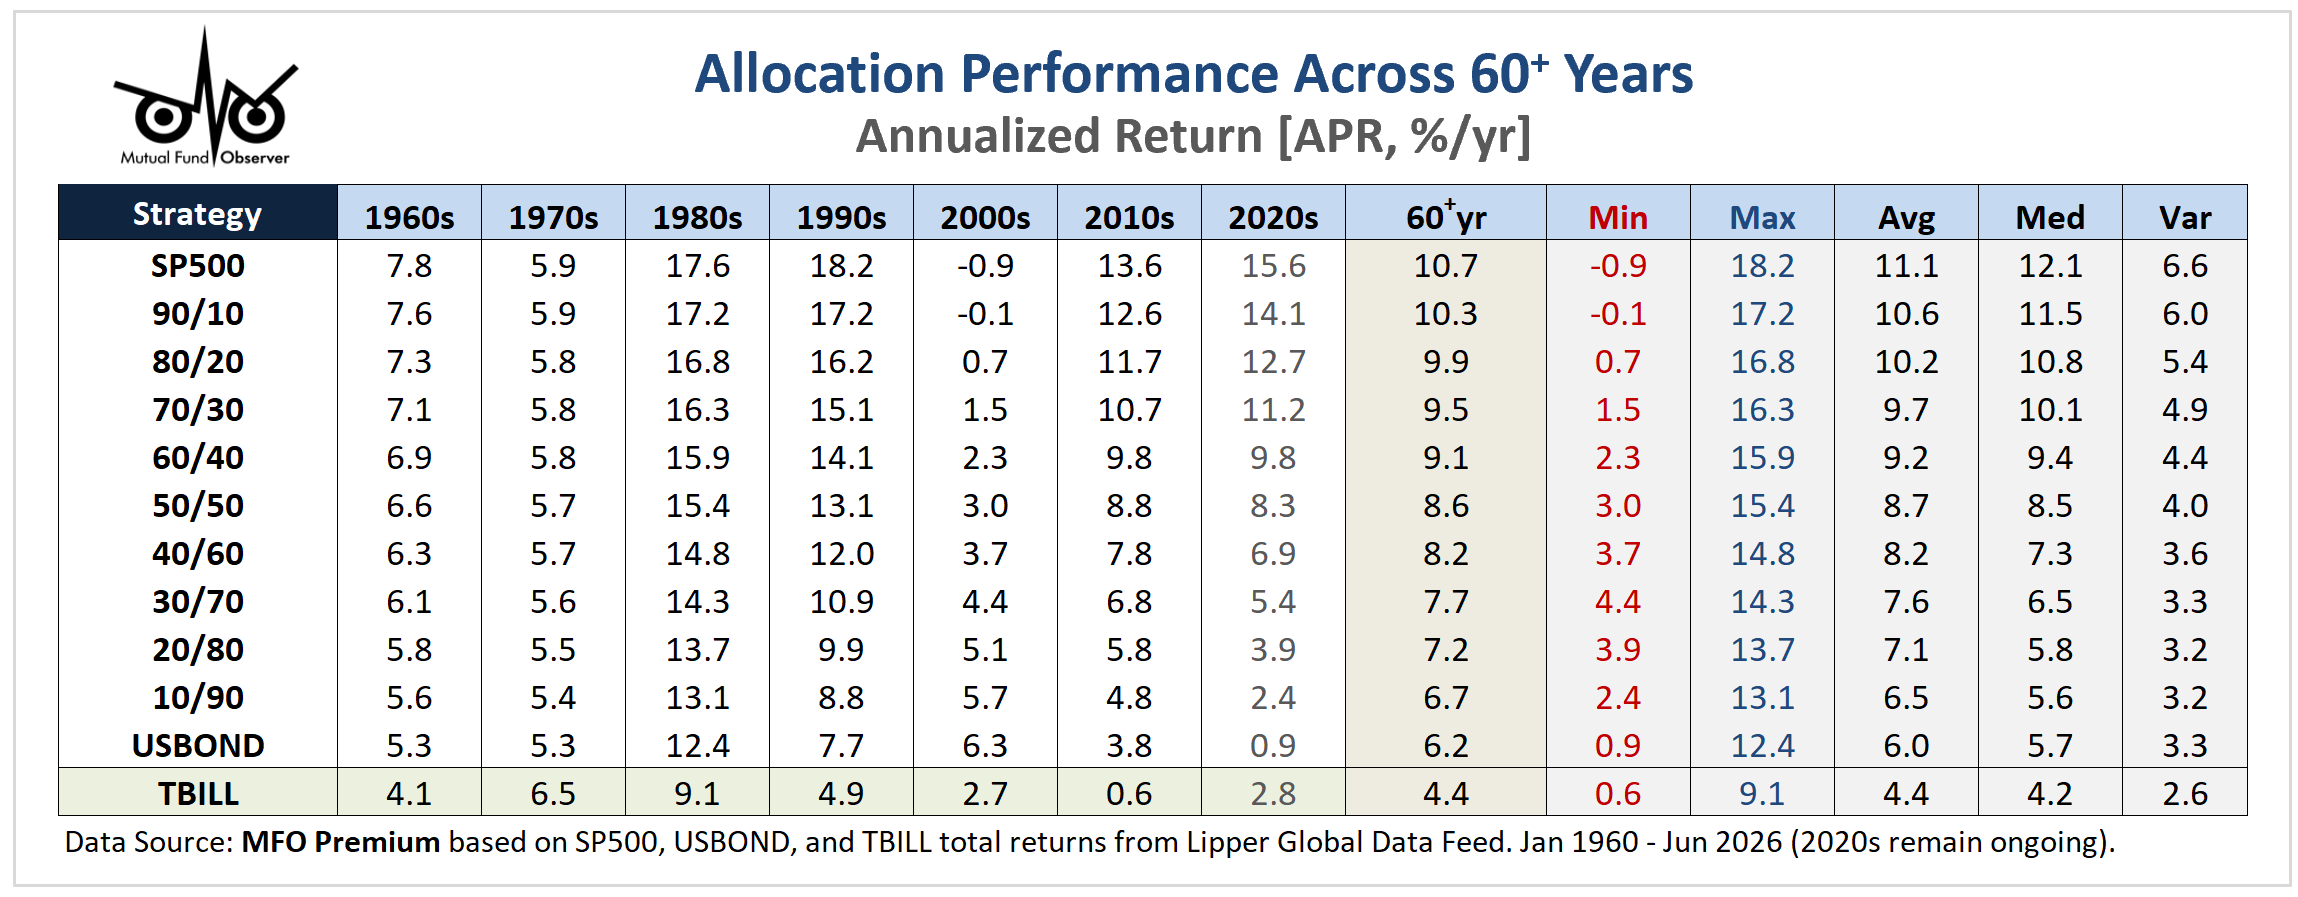
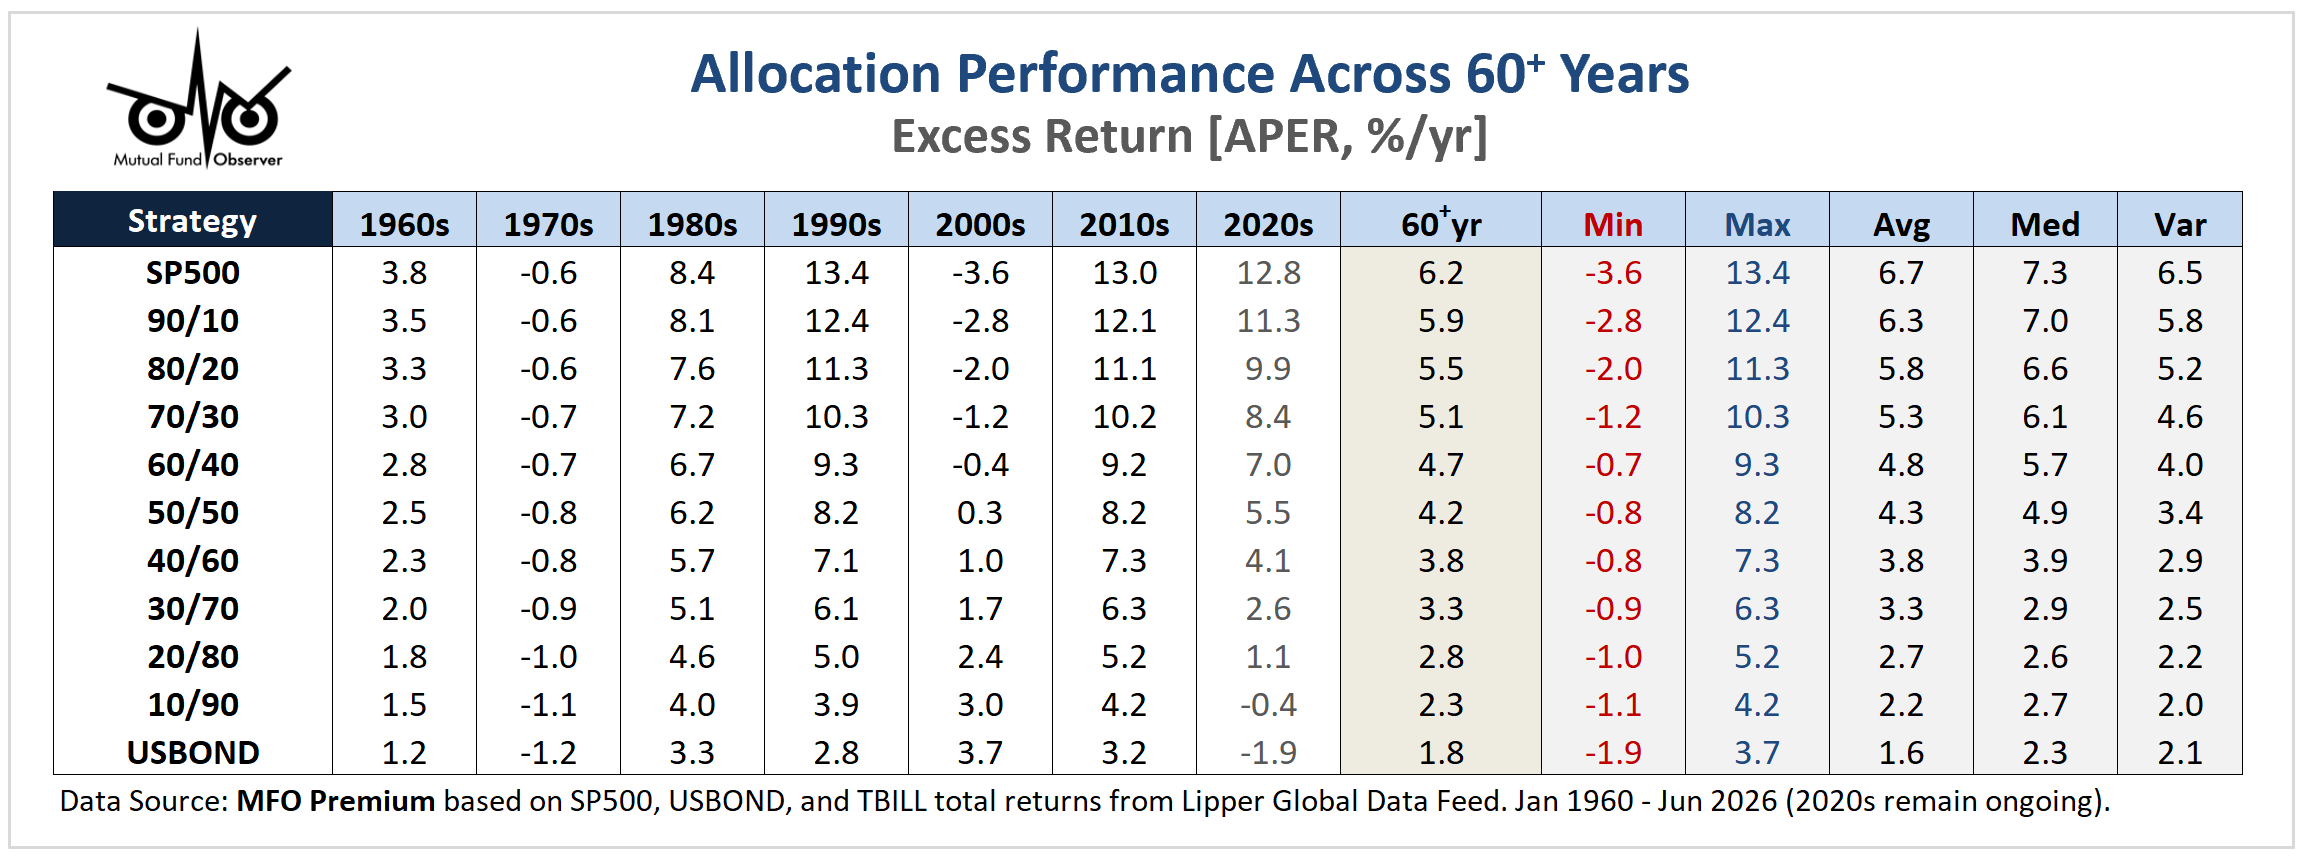
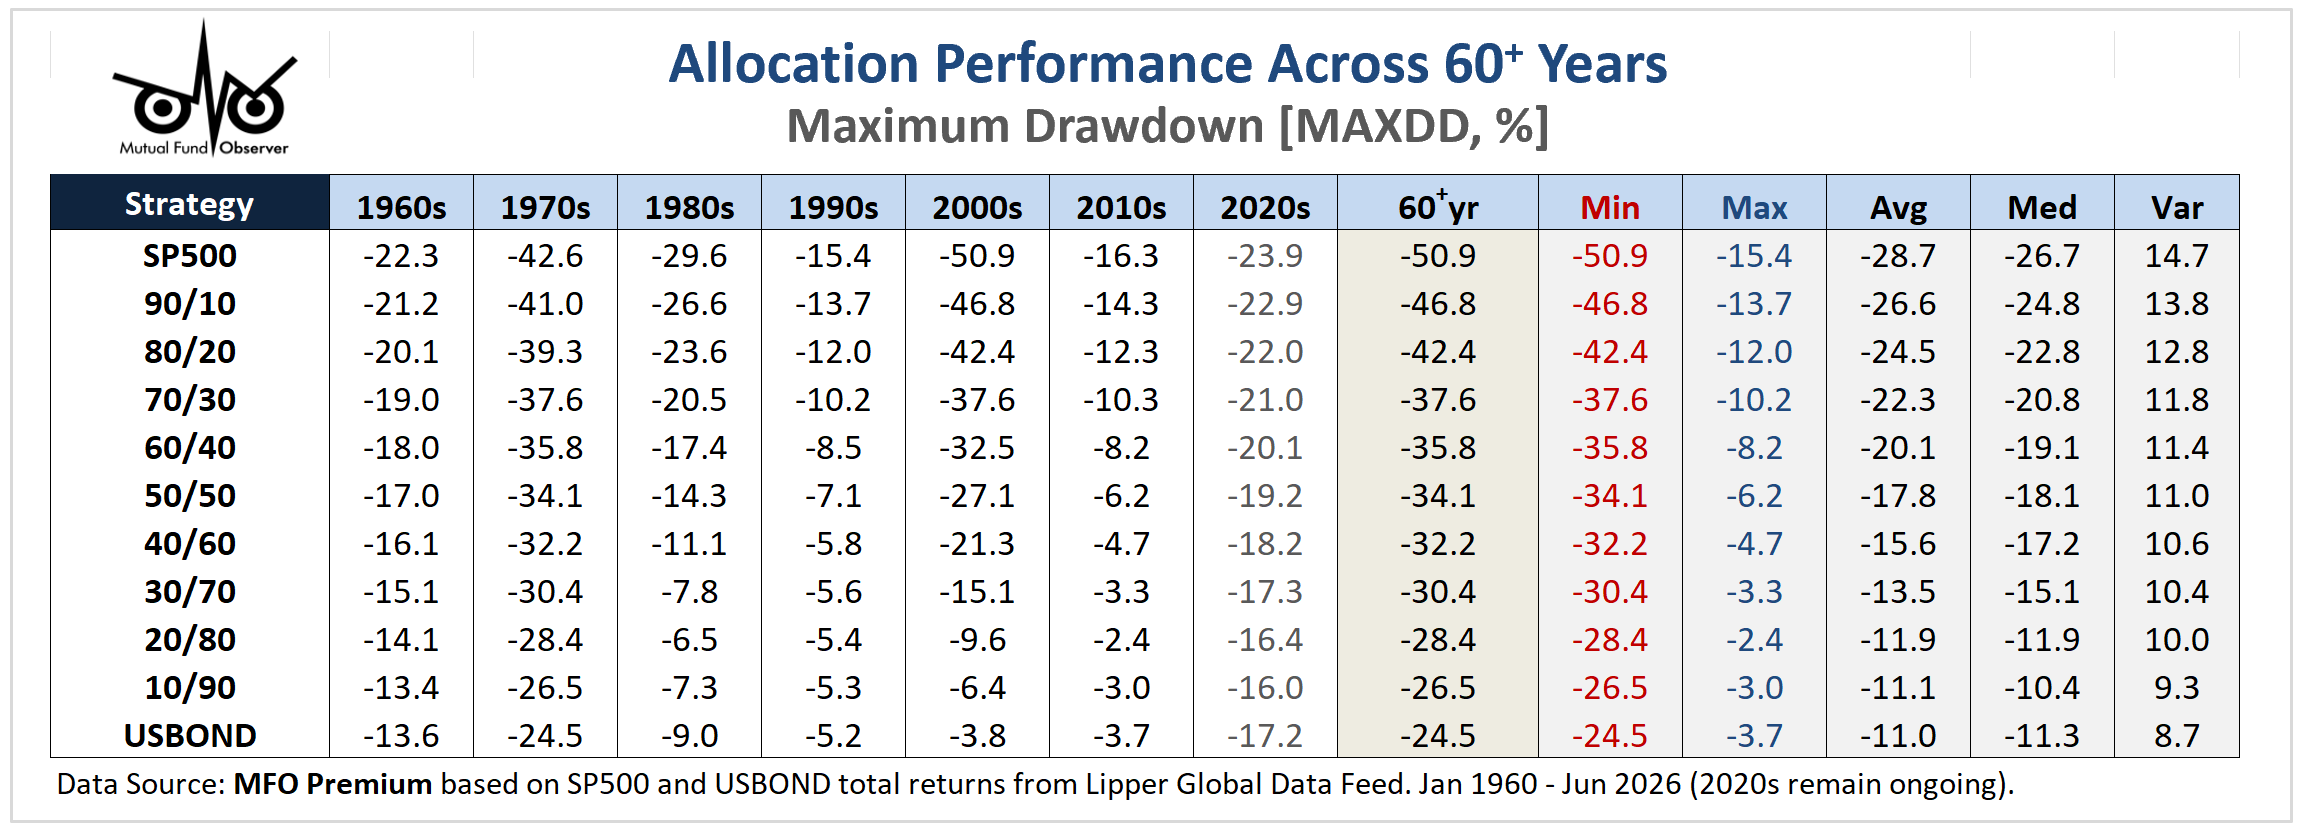


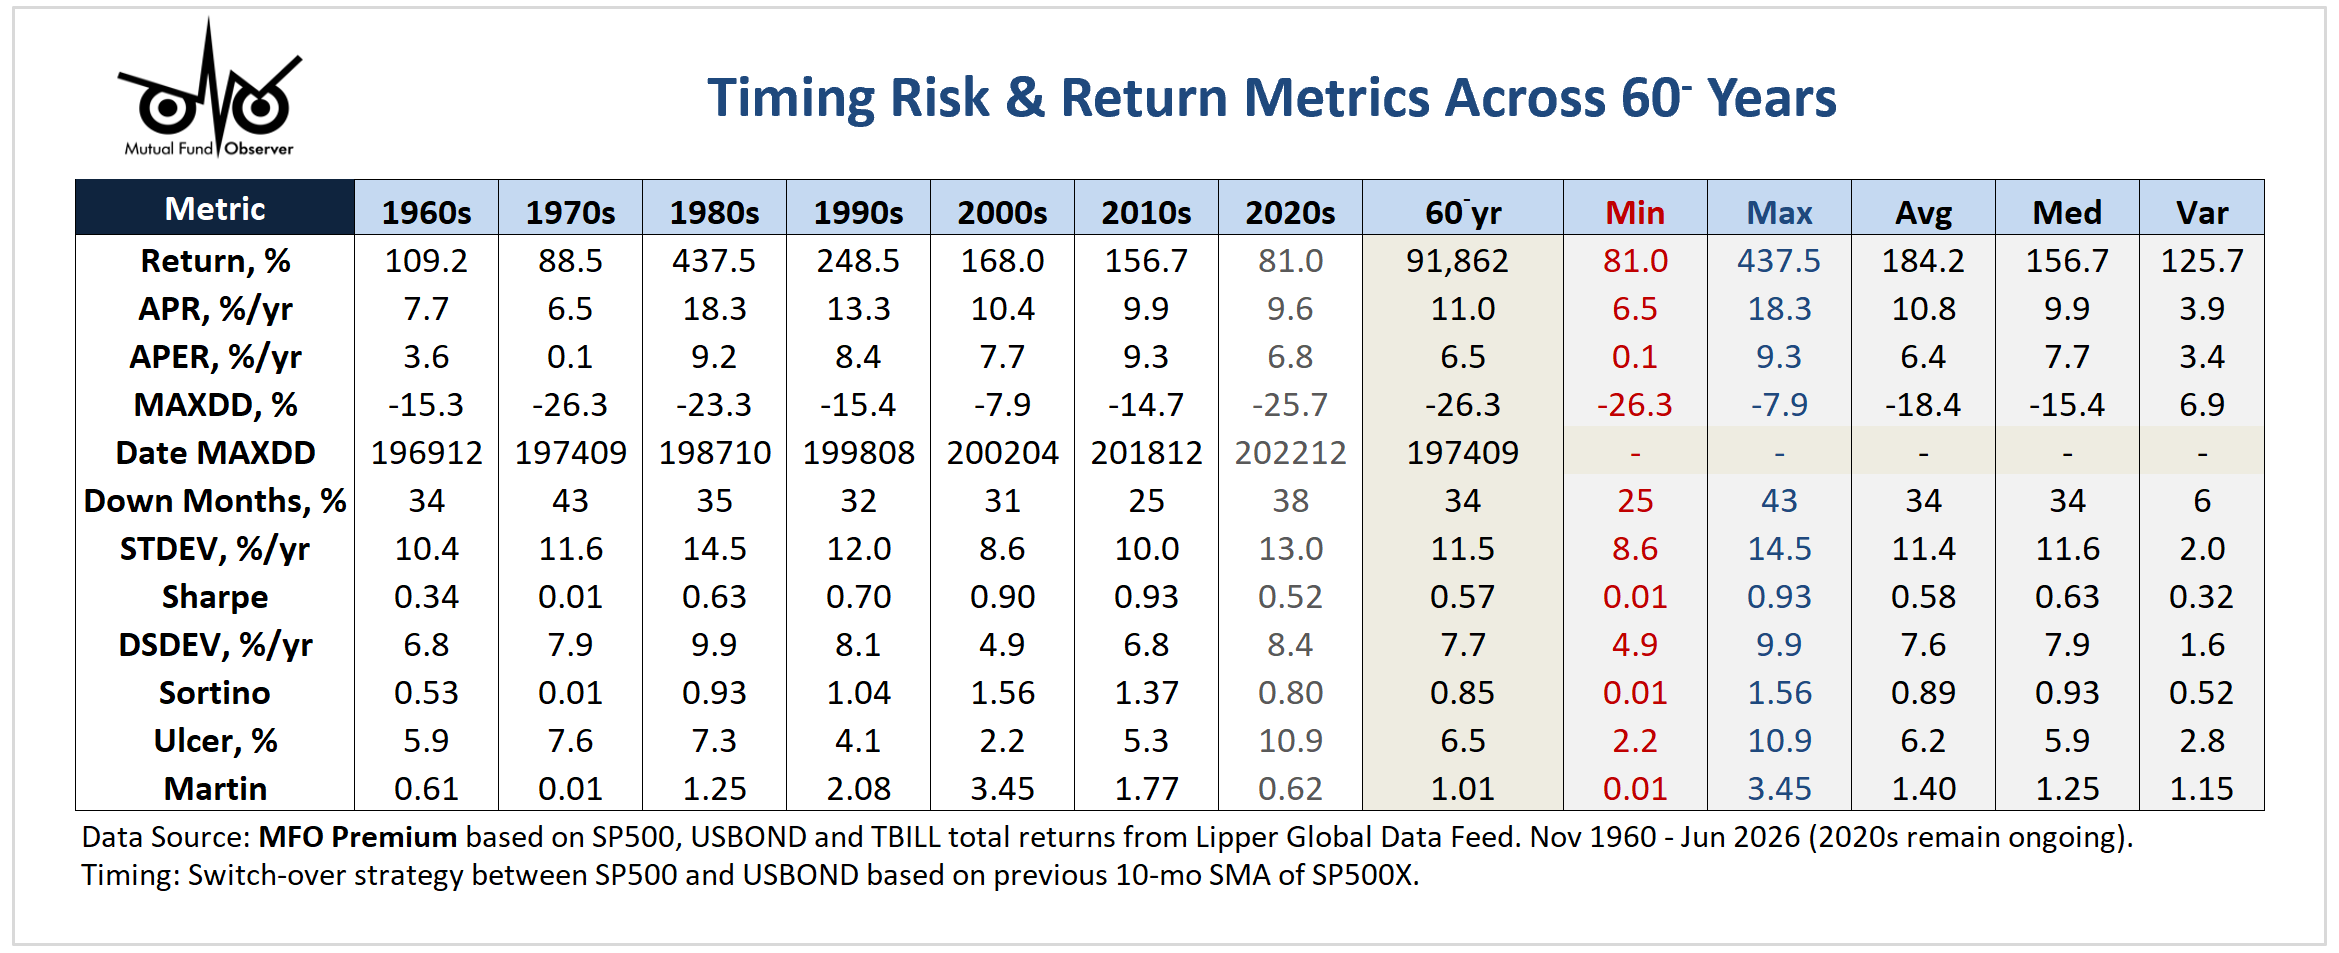
US Market Risk & Return Metrics Since 1960 - Timing Comparison